
AI看线 - A股技术分析与AI预测工具
About
Python-based stock analysis tool that combines traditional technical analysis with AI prediction capabilities. Providing comprehensive stock analysis and forecasting using K-line charts, technical indicators, financial data, and news data. With CMD/WEB/MCP supported.
Explore
- 使用AKShare获取A股历史交易、财务和新闻数据
- 计算MA、MACD、KDJ、RSI、布林带等多种技术指标
- 生成静态PNG和交互式HTML K线图及技术指标图表
- 利用多模态AI(如通义千问视觉模型)分析历史数据并预测走势
- 提供简洁美观的Web界面进行交互式分析
- 支持MCP协议,通过LLM自然语言交互随时分析股票

Setting up with Highlight
This MCP is not yet compatible with Highlight’s one-click setup. However, you can still use it with Highlight by following these steps:
- Download and install Highlight from highlightai.com/download
- Navigate to the plugins tab and select "Add Custom Plugin"
-
Configure the plugin with the settings below
Plugin Name
AI看线 - A股技术分析与AI预测工具Command (node, npx, python, etc.)Please refer to the README for specific instructions on how to obtain API keys or other required environment variables.
- Enable "Start Automatically" if you want the plugin to start when Highlight launches





From the repository
支持三种使用方式:命令行运行python main.py --stock_code 000001;启动Web服务python web_app.py后访问http://localhost:5000输入股票代码;或通过MCP Server(uv run mcp_server.py)在LLM客户端配置streamable-http端点http://localhost:8000/mcp交互分析。
<div align="center">
<!-- Keep these links. Translations will automatically update with the README. -->
<a href="README_EN.md">English</a> | <a href="README.md">中文</a>
</div>
Claude Desktop / Cursor
Paste into your MCP client config file to install this server.
{
    "mcpServers": {
        "ai\u770b\u7ebf - a\u80a1\u6280\u672f\u5206\u6790\u4e0eai\u9884\u6d4b\u5de5\u5177": {
            "AI-Kline": {
                "command": "python",
                "args": [
                    "main.py",
                    "--stock_code",
                    "000001",
                    "--period",
                    "1\u5e74",
                    "--save_path",
                    "./output"
                ]
            }
        }
    }
}McpServers
{
    "AI-Kline": {
        "command": "python",
        "args": [
            "main.py",
            "--stock_code",
            "000001",
            "--period",
            "1\u5e74",
            "--save_path",
            "./output"
        ]
    }
}
AI看线 - 股票技术分析与AI预测工具(AI-Kline - Stock Technical Analysis and AI Prediction Tool)
<div align="center">
<!-- Keep these links. Translations will automatically update with the README. -->
<a href="README_EN.md">English</a> | <a href="README.md">中文</a>
</div>
项目简介
AI看线是一个基于Python的A股分析工具,结合了传统技术分析和人工智能预测功能。利用K线图,技术指标,财务数据,新闻数据对股票进行全面分析及预测。该工具可以:
1. 获取A股股票的历史量价数据并计算各种技术指标
2. 生成专业的K线图和技术指标可视化图表
3. 获取股票相关的财务数据和新闻信息
4. 使用openai api分析整合数据并预测股票未来走势
功能特点
- 数据获取:使用AKShare获取A股股票的历史交易数据、财务数据和新闻信息
- 技术分析:计算多种技术指标,包括MA、MACD、KDJ、RSI、布林带等
- 可视化:生成静态和交互式K线图及技术指标图表
- AI分析:利用多模态AI分析股票数据并预测未来走势
- Web界面:提供简洁美观的Web界面,方便用户输入股票代码查看分析结果
- MCP SERVER:提供MCP SERVER支持,支持通过LLM交互,随时分析股票
安装说明
环境要求
- Python 3.8+
- 依赖包:见requirements.txt
安装步骤
1. 克隆或下载本项目到本地
2. 安装依赖包
pip install -r requirements.txt
3. 创建.env文件,添加API密钥
API_KEY=your_api_key_here
BASE_URL=https://dashscope.aliyuncs.com/compatible-mode/v1
MODEL_NAME=qwen-vl-max
> 注意:需使用多模态模型
使用方法
命令行使用
python main.py --stock_code 000001 --period 1年 --save_path ./output
参数说明:
- --stock_code:股票代码,必填参数
- --period:分析周期,可选值:"1年"、"6个月"、"3个月"、"1个月",默认为"1年"
- --save_path:结果保存路径,默认为"./output"
Web界面使用
启动Web服务:
python web_app.py
然后在浏览器中访问 http://localhost:5000 即可使用Web界面:
1. 在表单中输入股票代码(例如:000001)
2. 选择分析周期
3. 点击"开始分析"按钮
4. 等待分析完成后查看结果
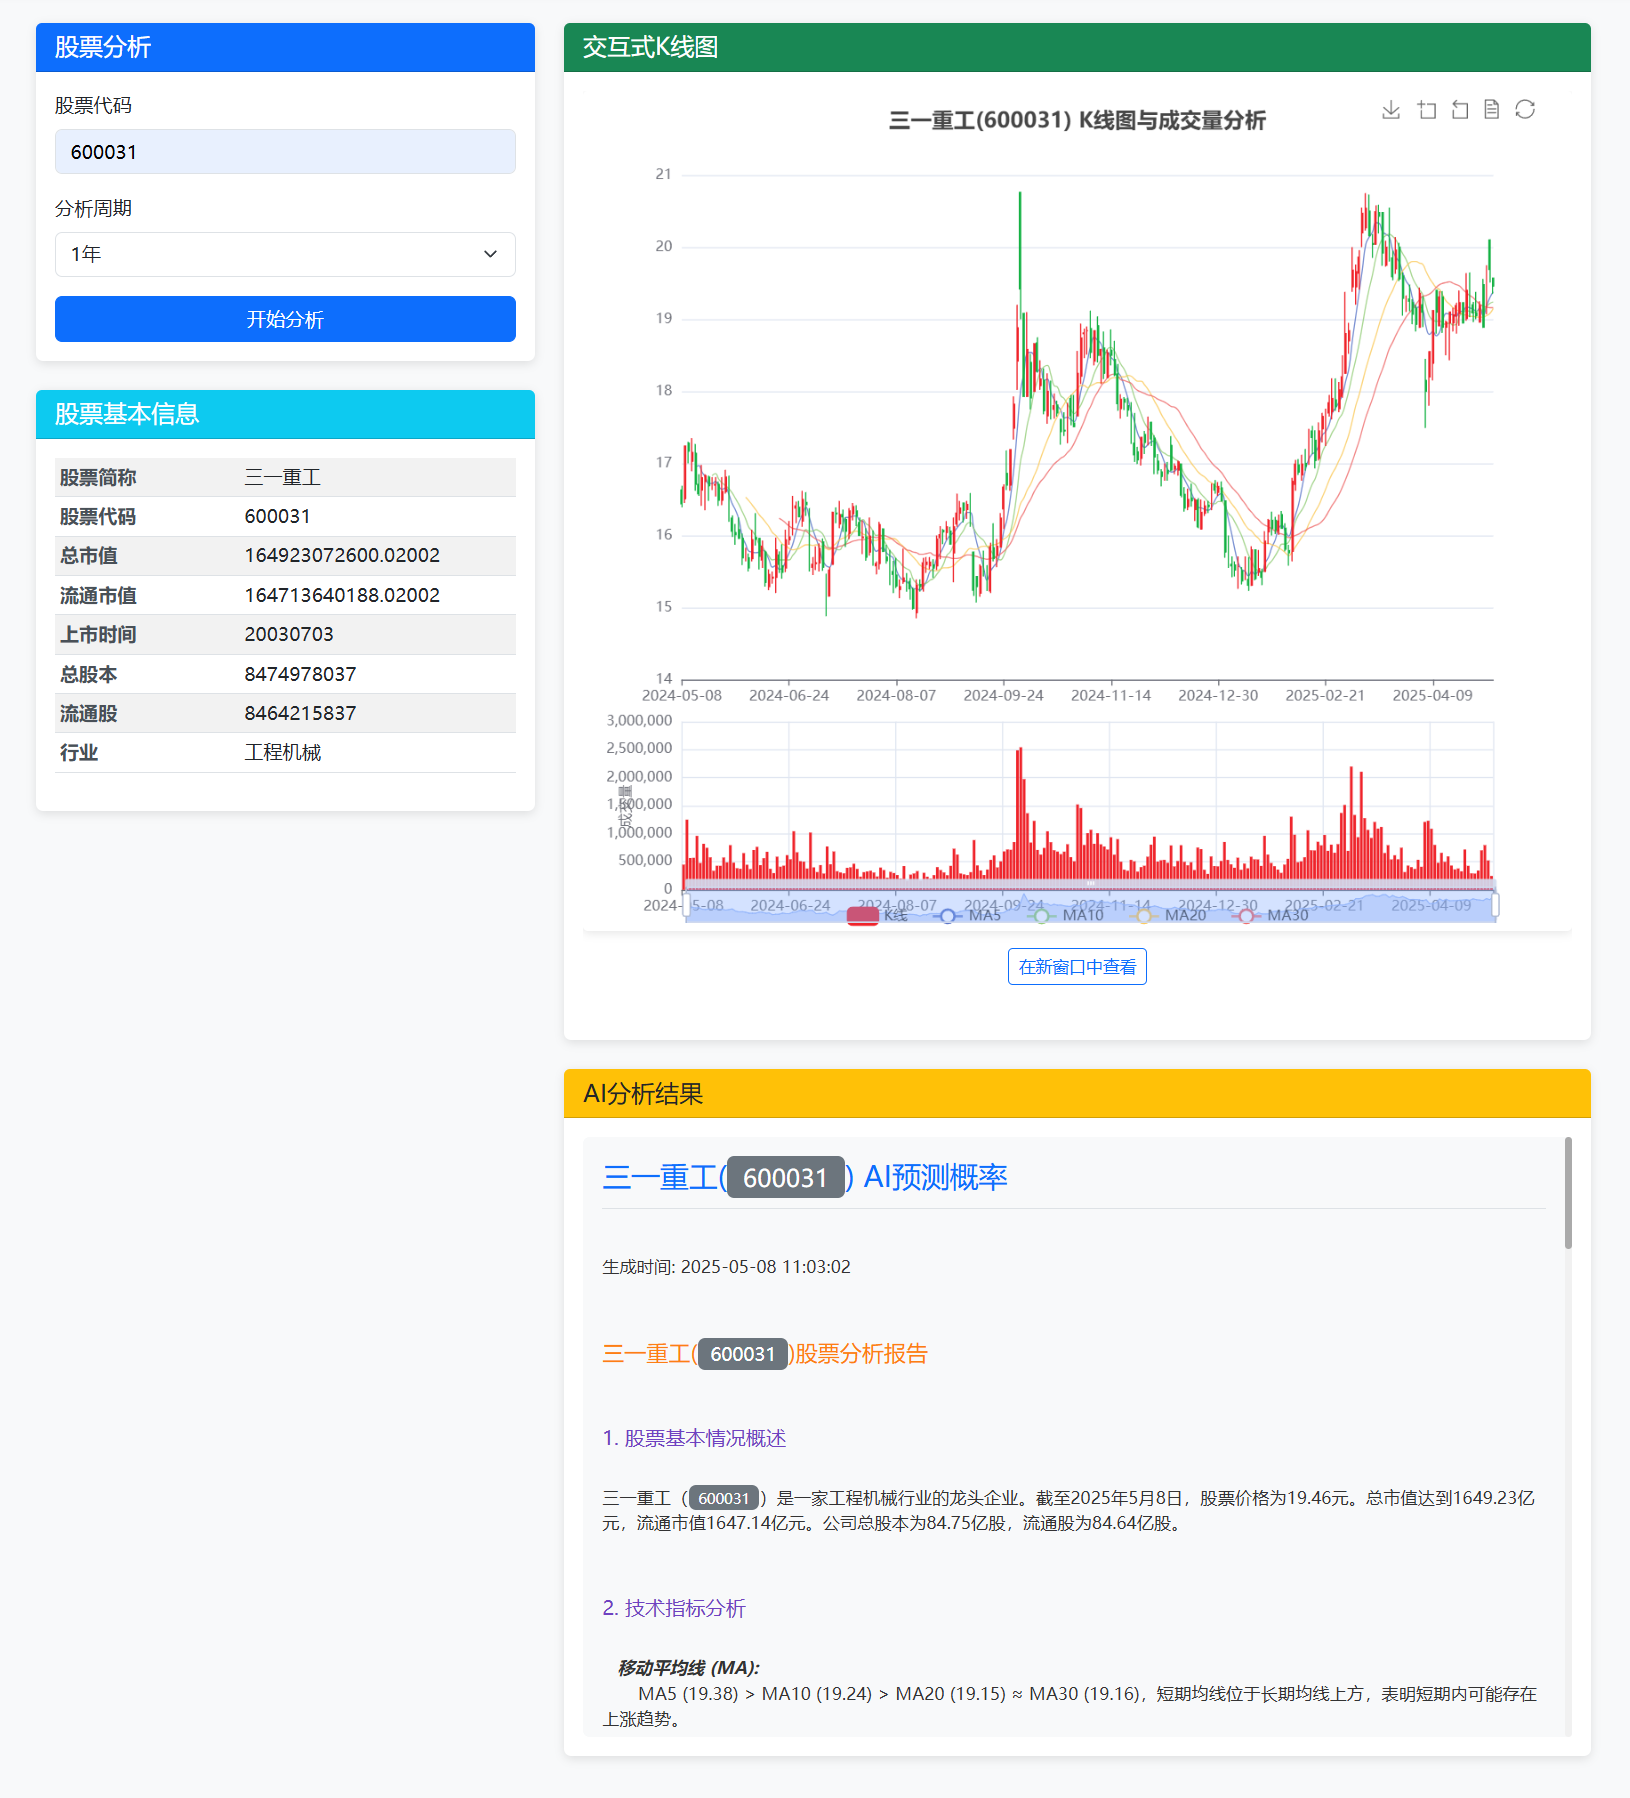
Web界面包括以下内容:
- 股票基本信息
- K线图和技术指标图表
- AI分析结果文本
页面截图:
MCP SERVER使用
启动mcp:
uv run mcp_server.py
然后在mcp客户端中配置(streamable-http):
http://localhost:8000/mcp
Cherry-Studio页面截图:
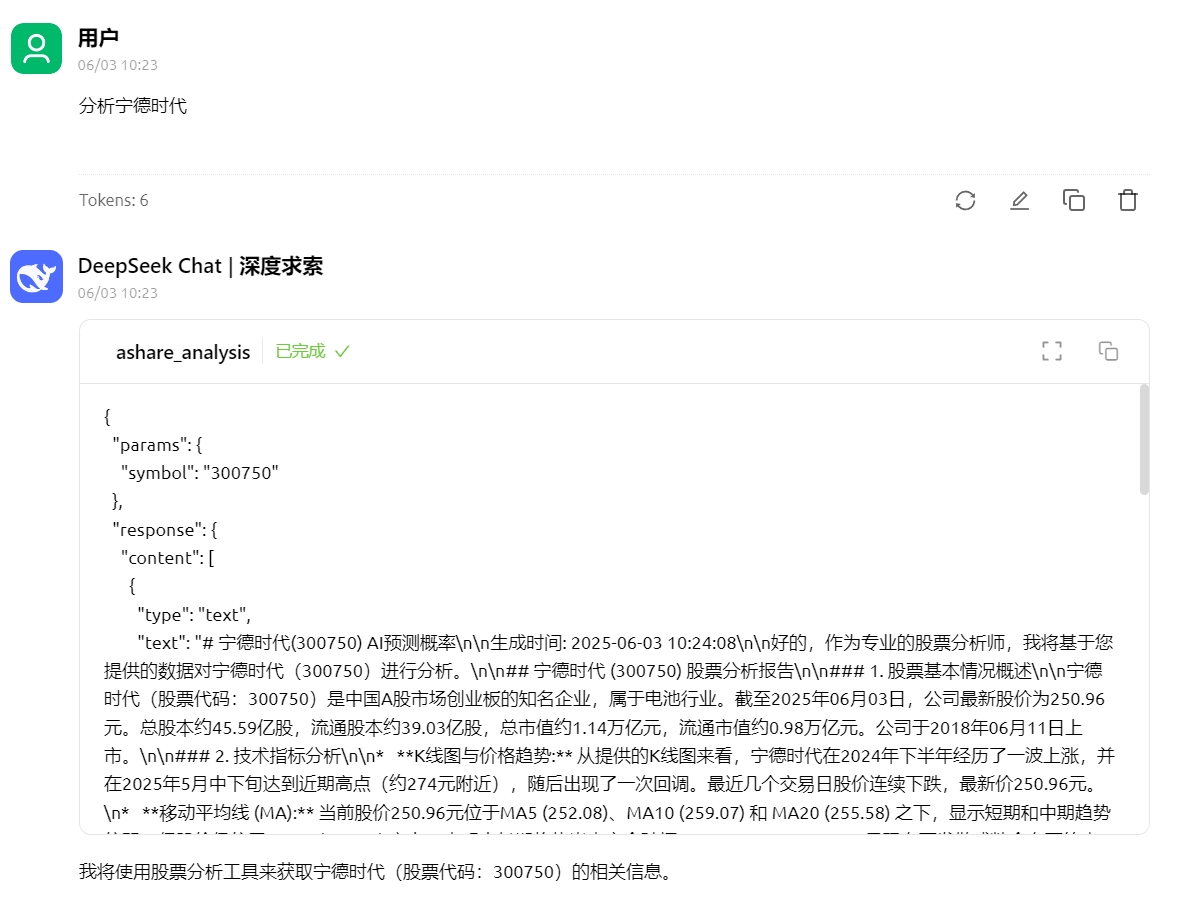
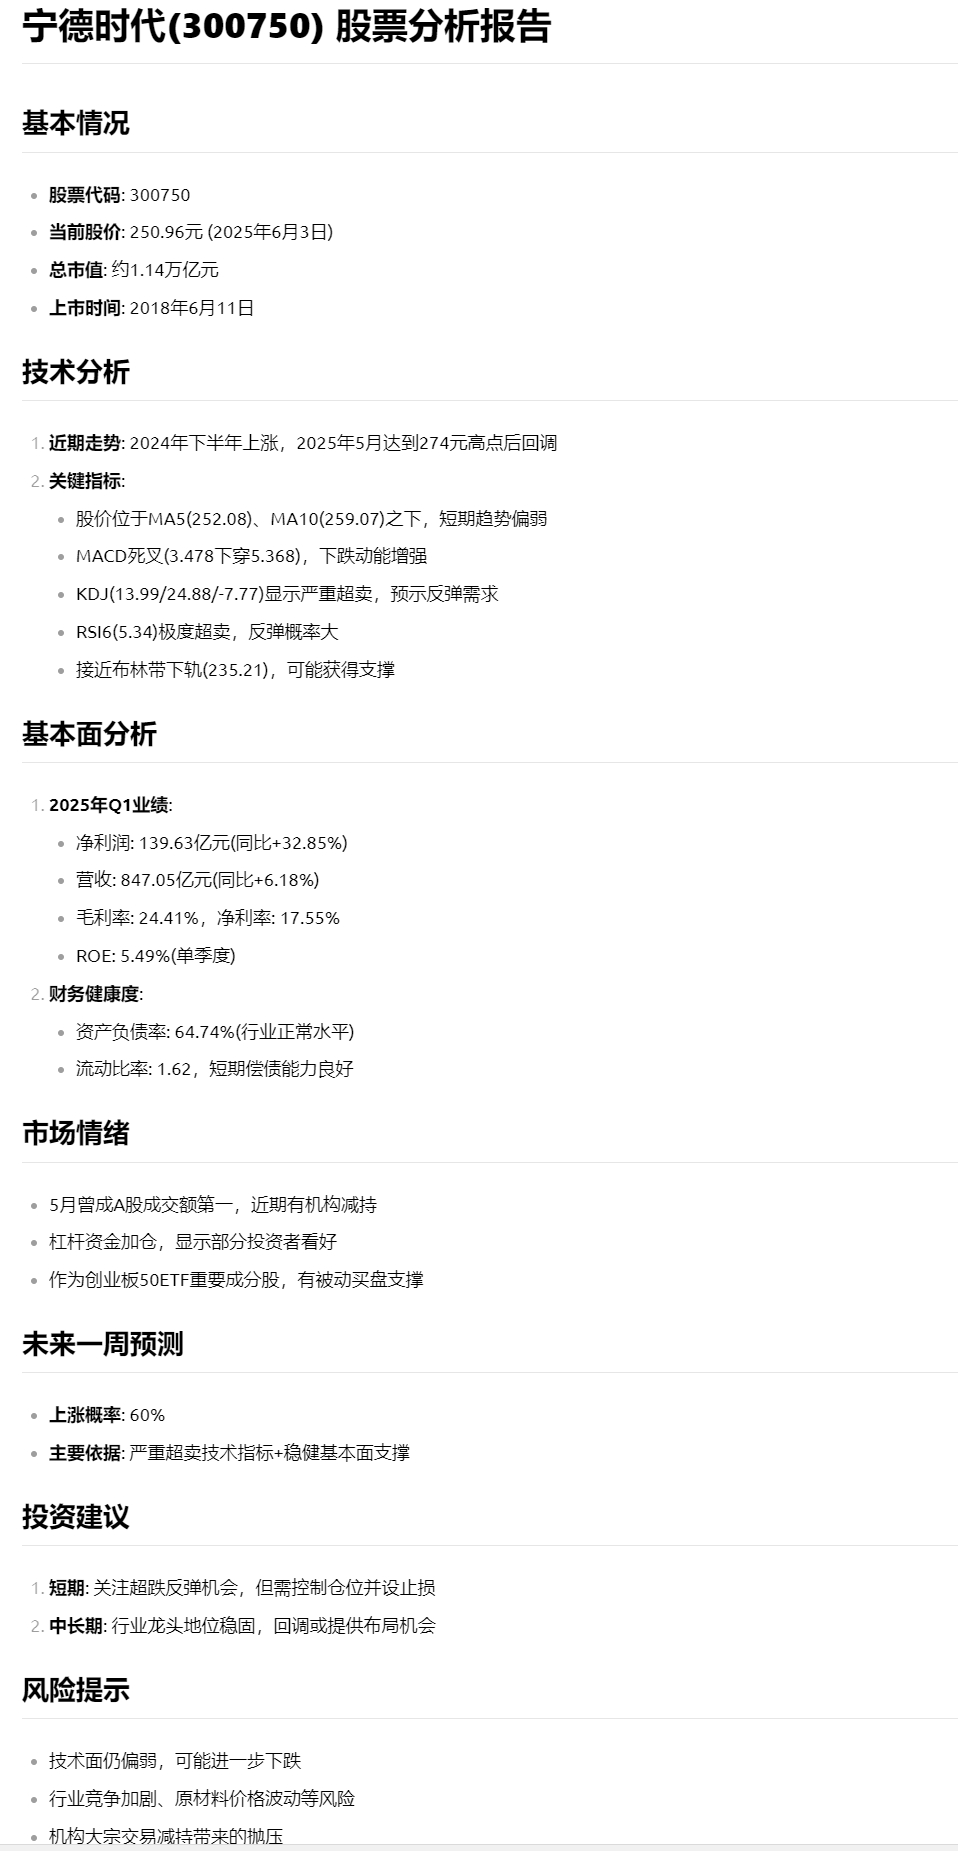
输出结果
程序运行后将在指定的保存路径下生成:
1. K线图和技术指标图表(静态PNG图片和交互式HTML图表)
2. AI分析结果文本文件
项目结构
AI看线/
├── main.py                 # 主程序入口
├── web_app.py              # Web应用入口
├── requirements.txt        # 依赖包列表
├── .env                    # 环境变量配置(需自行创建)
├── modules/                # 功能模块
│   ├── __init__.py
│   ├── data_fetcher.py     # 数据获取模块
│   ├── technical_analyzer.py # 技术分析模块
│   ├── visualizer.py       # 可视化模块
│   └── ai_analyzer.py      # AI分析模块
├── templates/              # Web模板目录
│   └── index.html          # 主页模板
├── static/                 # 静态资源目录
│   ├── css/                # CSS样式
│   │   └── style.css       # 自定义样式
│   └── js/                 # JavaScript脚本
│       └── main.js         # 主要脚本
└── output/                 # 输出结果目录(运行时自动创建)
    ├── charts/             # 图表目录
    └── *_analysis_result.txt # 分析结果文件
交流学习

注意事项
- 本工具仅供学习和研究使用,不构成任何投资建议
- AI分析结果基于历史数据和当前信息,不能保证未来走势的准确性
- 使用前请确保已正确配置Gemini API密钥
- 股票数据获取依赖于AKShare库,可能受到网络和数据源的限制
- 本项目为QuantML开源项目,转载或使用需注明出处,商业使用请联系微信号QuantML
免责声明
本工具提供的分析和预测仅供参考,不构成任何投资建议。投资有风险,入市需谨慎。用户应对自己的投资决策负责。
Sign in to leave a review
Use Google, GitHub, or an email account so ratings stay tied to real people.
No reviews posted yet.