VictoriaMetrics MCP Server
About
The implementation of Model Context Protocol (MCP) server for VictoriaMetrics
Details
- License
- Apache-2.0
Explore
This MCP server allows you to use almost all read-only APIs of VictoriaMetrics, i.e. all functions available in VMUI:
- Querying metrics and exploring data (even drawing graphs if your client supports it)
- Listing and exporting available metrics, labels, labels values and entire series
- Analyzing and testing your alerting and recording rules and alerts
- Showing parameters of your VictoriaMetrics instance
- Exploring cardinality of your data and metrics usage statistics
- Analyzing, tracing, prettifying and explaining your queries
- Debugging your relabeling rules, downsampling and retention policy configurations
- Integration with VictoriaMetrics Cloud
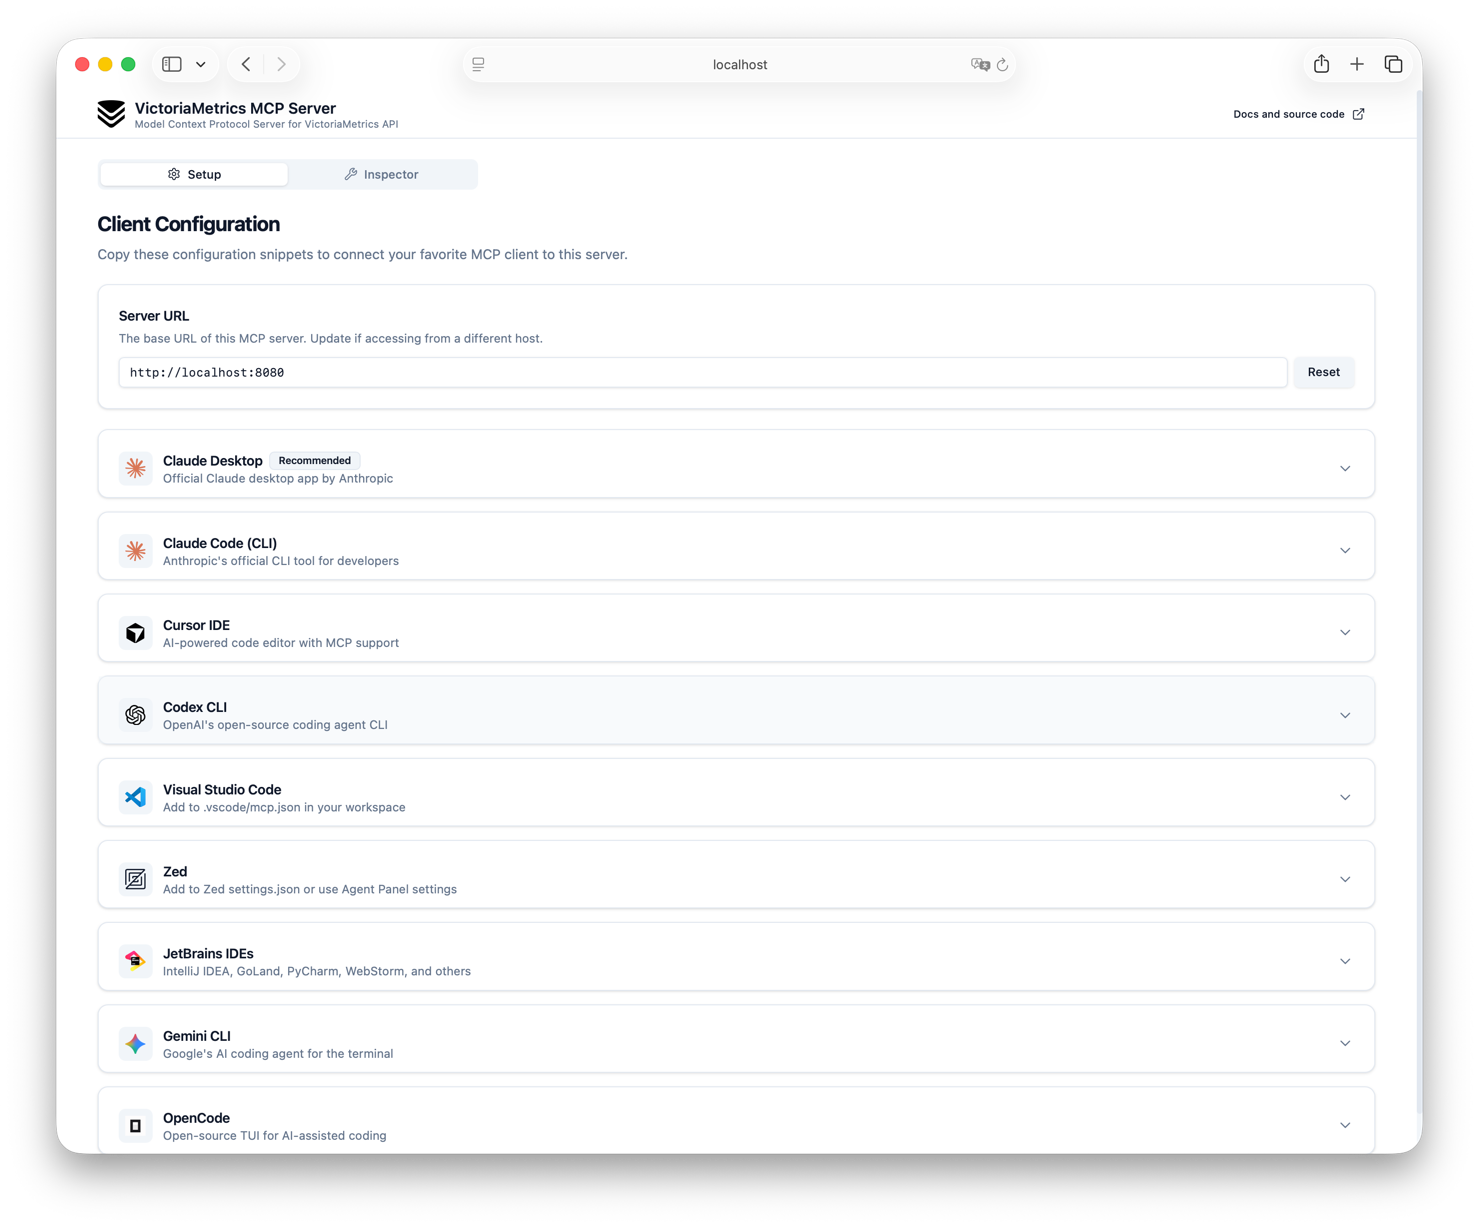
- UI with setup instrinctions and tools inspection on the root endpoint (only in Streamable HTTP mode)
In addition, the MCP server contains embedded up-to-date documentation and is able to search it without online access.
More details about the exact available tools and prompts can be found in the Usage section.
You can combine functionality of tools, docs search in your prompts and invent great usage scenarios for your VictoriaMetrics instance.
Just check the Dialog example section to see how it can work.
And please note the fact that the quality of the MCP Server and its responses depends very much on the capabilities of your client and the quality of the model you are using.
You can also combine the MCP server with other observability or doc search related MCP Servers and get even more powerful results.

Setting up with Highlight
This MCP is not yet compatible with Highlight’s one-click setup. However, you can still use it with Highlight by following these steps:
- Download and install Highlight from highlightai.com/download
- Navigate to the plugins tab and select "Add Custom Plugin"
-
Configure the plugin with the settings below
Plugin Name
VictoriaMetrics MCP ServerCommand (node, npx, python, etc.)Please refer to the README for specific instructions on how to obtain API keys or other required environment variables.
- Enable "Start Automatically" if you want the plugin to start when Highlight launches





From the repository
- VictoriaMetrics or VictoriaMetrics Cloud instance (single-node or cluster)
- Go 1.26 or higher (if you want to build from source)
There is a publicly available instance of the VictoriaMetrics MCP Server that you can use to test the features without installing it:
https://play-mcp.victoriametrics.com/mcp
Attention! This URL is not supposed to be opened in a browser, it is intended to be used in MCP clients.
It's available in Streamable HTTP mode and configured to work with Public VictoriaMetrics Playground.
Here is example of configuration for Claude Desktop:
```
query
Execute instant PromQL/MetricsQL queries
query_range
Execute range PromQL/MetricsQL queries over a time period
metrics
List available metrics
metrics_metadata
Stored metrics metadata (type, help and unit)
labels
List available label names
label_values
List values for a specific label
series
List available time series
export
Export raw time series data to JSON or CSV
rules
View alerting and recording rules
alerts
View current alerts (firing and pending)
flags
View non-default flags of the VictoriaMetrics instance
metric_statistics
Get metrics usage (in queries) statistics
active_queries
View currently executing queries
top_queries
View most frequent or slowest queries
tsdb_status
View TSDB cardinality statistics
tenants
List available tenants in multi-tenant cluster setup
documentation
Search in embedded VictoriaMetrics documentation
metric_relabel_debug
Debug Prometheus-compatible relabeling rules
downsampling_filters_debug
Debug downsampling configuration
retention_filters_debug
Debug retention filters configuration
prettify_query
Prettify and format PromQL/MetricsQL queries
explain_query
Parse PromQL/MetricsQL queries and explain how it works
test_rules
Unit-test alerting and recording rules using vmalert tool
deployments
List available deployments in VictoriaMetrics Cloud
cloud_providers
List available cloud providers in VictoriaMetrics Cloud
regions
List available cloud providers regions in VictoriaMetrics Cloud
tiers
List available deployment tiers in VictoriaMetrics Cloud
access_tokens
List available deployment access tokens in VictoriaMetrics Cloud
rule_filenames
List available alerting and recording rule filenames in VictoriaMetrics Cloud
rule_file
Content of a specific alerting or recording rule file in VictoriaMetrics Cloud
MCP VictoriaMetrics provides numerous tools for interacting with your VictoriaMetrics instance.
Here's a list of common available tools:
| Tool | Description | Enabled by default |
|------------------------------|-----------------------------------------------------------|:------------------:|
| query | Execute instant PromQL/MetricsQL queries | ✅ |
| query_range | Execute range PromQL/MetricsQL queries over a time period | ✅ |
| metrics | List available metrics | ✅ |
| metrics_metadata | Stored metrics metadata (type, help and unit) | ✅ |
| labels | List available label names | ✅ |
| label_values | List values for a specific label | ✅ |
| series | List available time series | ✅ |
| export | Export raw time series data to JSON or CSV | ❌ |
| rules | View alerting and recording rules | ✅ |
| alerts | View current alerts (firing and pending) | ✅ |
| flags | View non-default flags of the VictoriaMetrics instance | ❌ |
| metric_statistics | Get metrics usage (in queries) statistics | ✅ |
| active_queries | View currently executing queries | ✅ |
| top_queries | View most frequent or slowest queries | ✅ |
| tsdb_status | View TSDB cardinality statistics | ✅ |
| tenants | List available tenants in multi-tenant cluster setup | ✅ |
| documentation | Search in embedded VictoriaMetrics documentation | ✅ |
| metric_relabel_debug | Debug Prometheus-compatible relabeling rules | ❌ |
| downsampling_filters_debug | Debug downsampling configuration | ❌ |
| retention_filters_debug | Debug retention filters configuration | ❌ |
| prettify_query | Prettify and format PromQL/MetricsQL queries | ✅ |
| explain_query | Parse PromQL/MetricsQL queries and explain how it works | ✅ |
| test_rules | Unit-test alerting and recording rules using vmalert tool | ❌ |
Here are some additional tools that are available for VictoriaMetrics Cloud (with specifying VMC_API_KEY parameter) users:
| Tool | Description | Enabled by default |
|-------------------|--------------------------------------------------------------------------------|:------------------:|
| deployments | List available deployments in VictoriaMetrics Cloud | ✅ |
| cloud_providers | List available cloud providers in VictoriaMetrics Cloud | ✅ |
| regions | List available cloud providers regions in VictoriaMetrics Cloud | ✅ |
| tiers | List available deployment tiers in VictoriaMetrics Cloud | ✅ |
| access_tokens | List available deployment access tokens in VictoriaMetrics Cloud | ✅ |
| rule_filenames | List available alerting and recording rule filenames in VictoriaMetrics Cloud | ✅ |
| rule_file | Content of a specific alerting or recording rule file in VictoriaMetrics Cloud | ✅ |
Claude Desktop / Cursor
Paste into your MCP client config file to install this server.
{
    "mcpServers": {
        "victoriametrics mcp server": {
            "victoriametrics": {
                "command": "/path/to/mcp-victoriametrics",
                "env": {
                    "VM_INSTANCE_ENTRYPOINT": "<YOUR_VM_INSTANCE>",
                    "VM_INSTANCE_TYPE": "<YOUR_VM_INSTANCE_TYPE>",
                    "VM_INSTANCE_BEARER_TOKEN": "<YOUR_VM_BEARER_TOKEN>"
                }
            }
        }
    }
}McpServers
{
    "victoriametrics": {
        "command": "/path/to/mcp-victoriametrics",
        "env": {
            "VM_INSTANCE_ENTRYPOINT": "<YOUR_VM_INSTANCE>",
            "VM_INSTANCE_TYPE": "<YOUR_VM_INSTANCE_TYPE>",
            "VM_INSTANCE_BEARER_TOKEN": "<YOUR_VM_BEARER_TOKEN>"
        }
    }
}


The implementation of Model Context Protocol (MCP) server for VictoriaMetrics.
This provides access to your VictoriaMetrics instance and seamless integration with VictoriaMetrics APIs and documentation.
It can give you a comprehensive interface for monitoring, observability, and debugging tasks related to your VictoriaMetrics instances, enable advanced automation and interaction capabilities for engineers and tools.
Features
This MCP server allows you to use almost all read-only APIs of VictoriaMetrics, i.e. all functions available in VMUI:
- Querying metrics and exploring data (even drawing graphs if your client supports it)
- Listing and exporting available metrics, labels, labels values and entire series
- Analyzing and testing your alerting and recording rules and alerts
- Showing parameters of your VictoriaMetrics instance
- Exploring cardinality of your data and metrics usage statistics
- Analyzing, tracing, prettifying and explaining your queries
- Debugging your relabeling rules, downsampling and retention policy configurations
- Integration with VictoriaMetrics Cloud
- UI with setup instrinctions and tools inspection on the root endpoint (only in Streamable HTTP mode)
In addition, the MCP server contains embedded up-to-date documentation and is able to search it without online access.
More details about the exact available tools and prompts can be found in the Usage section.
You can combine functionality of tools, docs search in your prompts and invent great usage scenarios for your VictoriaMetrics instance.
Just check the Dialog example section to see how it can work.
And please note the fact that the quality of the MCP Server and its responses depends very much on the capabilities of your client and the quality of the model you are using.
You can also combine the MCP server with other observability or doc search related MCP Servers and get even more powerful results.
Try without installation
There is a publicly available instance of the VictoriaMetrics MCP Server that you can use to test the features without installing it:
https://play-mcp.victoriametrics.com/mcp
Attention! This URL is not supposed to be opened in a browser, it is intended to be used in MCP clients.
It's available in Streamable HTTP mode and configured to work with Public VictoriaMetrics Playground.
Here is example of configuration for Claude Desktop:
Requirements
- VictoriaMetrics or VictoriaMetrics Cloud instance (single-node or cluster)
- Go 1.26 or higher (if you want to build from source)
Installation
Binaries
Just download the latest release from Releases page and put it to your PATH.
Example for Linux x86_64 (note that other architectures and platforms are also available):
latest=$(curl -s https://api.github.com/repos/VictoriaMetrics/mcp-victoriametrics/releases/latest | grep 'tag_name' | cut -d\" -f4)
wget https://github.com/VictoriaMetrics/mcp-victoriametrics/releases/download/$latest/mcp-victoriametrics_Linux_x86_64.tar.gz
tar axvf mcp-victoriametrics_Linux_x86_64.tar.gz
Docker
You can run VictoriaMetrics MCP Server using Docker.
This is the easiest way to get started without needing to install Go or build from source.
docker run -d --name mcp-victoriametrics \
  -e VM_INSTANCE_ENTRYPOINT=https://play.victoriametrics.com \
  -e VM_INSTANCE_TYPE=cluster \
  -e MCP_SERVER_MODE=sse \
  -e MCP_LISTEN_ADDR=:8080 \
  -p 8080:8080 \
  ghcr.io/victoriametrics/mcp-victoriametrics
You should replace environment variables with your own parameters.
Note that the MCP_SERVER_MODE=http flag is used to enable Streamable HTTP mode.
More details about server modes can be found in the Configuration section.
See available docker images in github registry.
Also see Using Docker instead of binary section for more details about using Docker with MCP server with clients in stdio mode.
Source Code
For building binary from source code you can use the following approach:
- Clone repo:
  git clone https://github.com/VictoriaMetrics/mcp-victoriametrics.git

  cd mcp-victoriametrics
- Build binary from cloned source code:
  make build

  # after that you can find binary mcp-victoriametrics and copy this file to your PATH or run inplace
- Build image from cloned source code:
  docker build -t mcp-victoriametrics .

  # after that you can use docker image mcp-victoriametrics for running or pushing
Helm
Check out VictoriaMetrics MCP Server Helm chart documentation for more details about installation using Helm.
Configuration
MCP Server for VictoriaMetrics is configured via environment variables:
| Variable | Description | Required | Default | Allowed values |
|------------------------------------------|---------------------------------------------------------------------------------------------------------------------------------------------------------------------------------------------------------------------------------------------------------------------|----------------------------------------|---------------------------------------------------------------------------------------------------|------------------------|
| VM_INSTANCE_ENTRYPOINT / VMC_API_KEY | URL to VictoriaMetrics instance (it should be root / URL of vmsingle or vmselect) | Yes (if you don't use VMC_API_KEY) | - | - |
| VM_INSTANCE_TYPE | Type of VictoriaMetrics instance | Yes (if you don't use `VMC_API_KEY) | - | single, cluster |VM_INSTANCE_BEARER_TOKEN
| | Authentication token for VictoriaMetrics API | No | - | - |VM_INSTANCE_HEADERS
| | Custom HTTP headers to send with requests (comma-separated key=value pairs) | No | - | - |MCP_PASSTHROUGH_HEADERS
| | HTTP header names to forward from incoming MCP requests to VictoriaMetrics (comma-separated list). Overrides VM_INSTANCE_HEADERS on collision. Only applies in sse/http modes. | No | - | - |VM_DEFAULT_TENANT_ID
| | Default tenant ID for cluster mode. Format: accountID or accountID:projectID (32-bit integers). See VictoriaMetrics cluster docs | No | 0 | - |VMC_API_KEY
| | API key from VictoriaMetrics Cloud Console | No | - | - |MCP_SERVER_MODE
| | Server operation mode. See Modes for details. | No | stdio | stdio, sse, http |MCP_LISTEN_ADDR
| | Address for SSE or HTTP server to listen on | No | localhost:8080 | - |MCP_DISABLED_TOOLS
| | Comma-separated list of tools to disable | No | 'export,flags,metric_relabel_debug,downsampling_filters_debug,retention_filters_debug,test_rules' | - |MCP_DISABLE_RESOURCES
| | Disable all resources (documentation tool will continue to work) | No | false | false, true | MCP_HEARTBEAT_INTERVAL
| | Defines the heartbeat interval for the streamable-http protocol. <br /> It means the MCP server will send a heartbeat to the client through the GET connection, <br /> to keep the connection alive from being closed by the network infrastructure (e.g. gateways) | No | 30s | - |MCP_LOG_FORMAT
| | Log output format | No | text | text, json |MCP_LOG_LEVEL
| | Minimum log level | No | info | debug, info, warn, error |
You can use two options to connect to your VictoriaMetrics instance:
- Using VM_INSTANCE_ENTRYPOINT + VM_INSTANCE_TYPE + VM_INSTANCE_BEARER_TOKEN (optional) environment variables to connect to any single-node or cluster instance of VictoriaMetrics.VMC_API_KEY
- Using environment variable to work with your VictoriaMetrics Cloud instances.
Modes
MCP Server supports the following modes of operation (transports):
- stdio - Standard input/output mode, where the server reads commands from standard input and writes responses to standard output. This is the default mode and is suitable for local servers.sse
- - Server-Sent Events. Server will expose the /sse and /message endpoints for SSE connections.http
- - Streamable HTTP. Server will expose the /mcp endpoint for HTTP connections.
More info about traqnsports you can find in MCP docs:
- Core concepts -> Transports
- Specifications -> Transports
Сonfiguration examples
``bash
Sign in to leave a review
Use Google, GitHub, or an email account so ratings stay tied to real people.
No reviews posted yet.