Superbased Observer
About
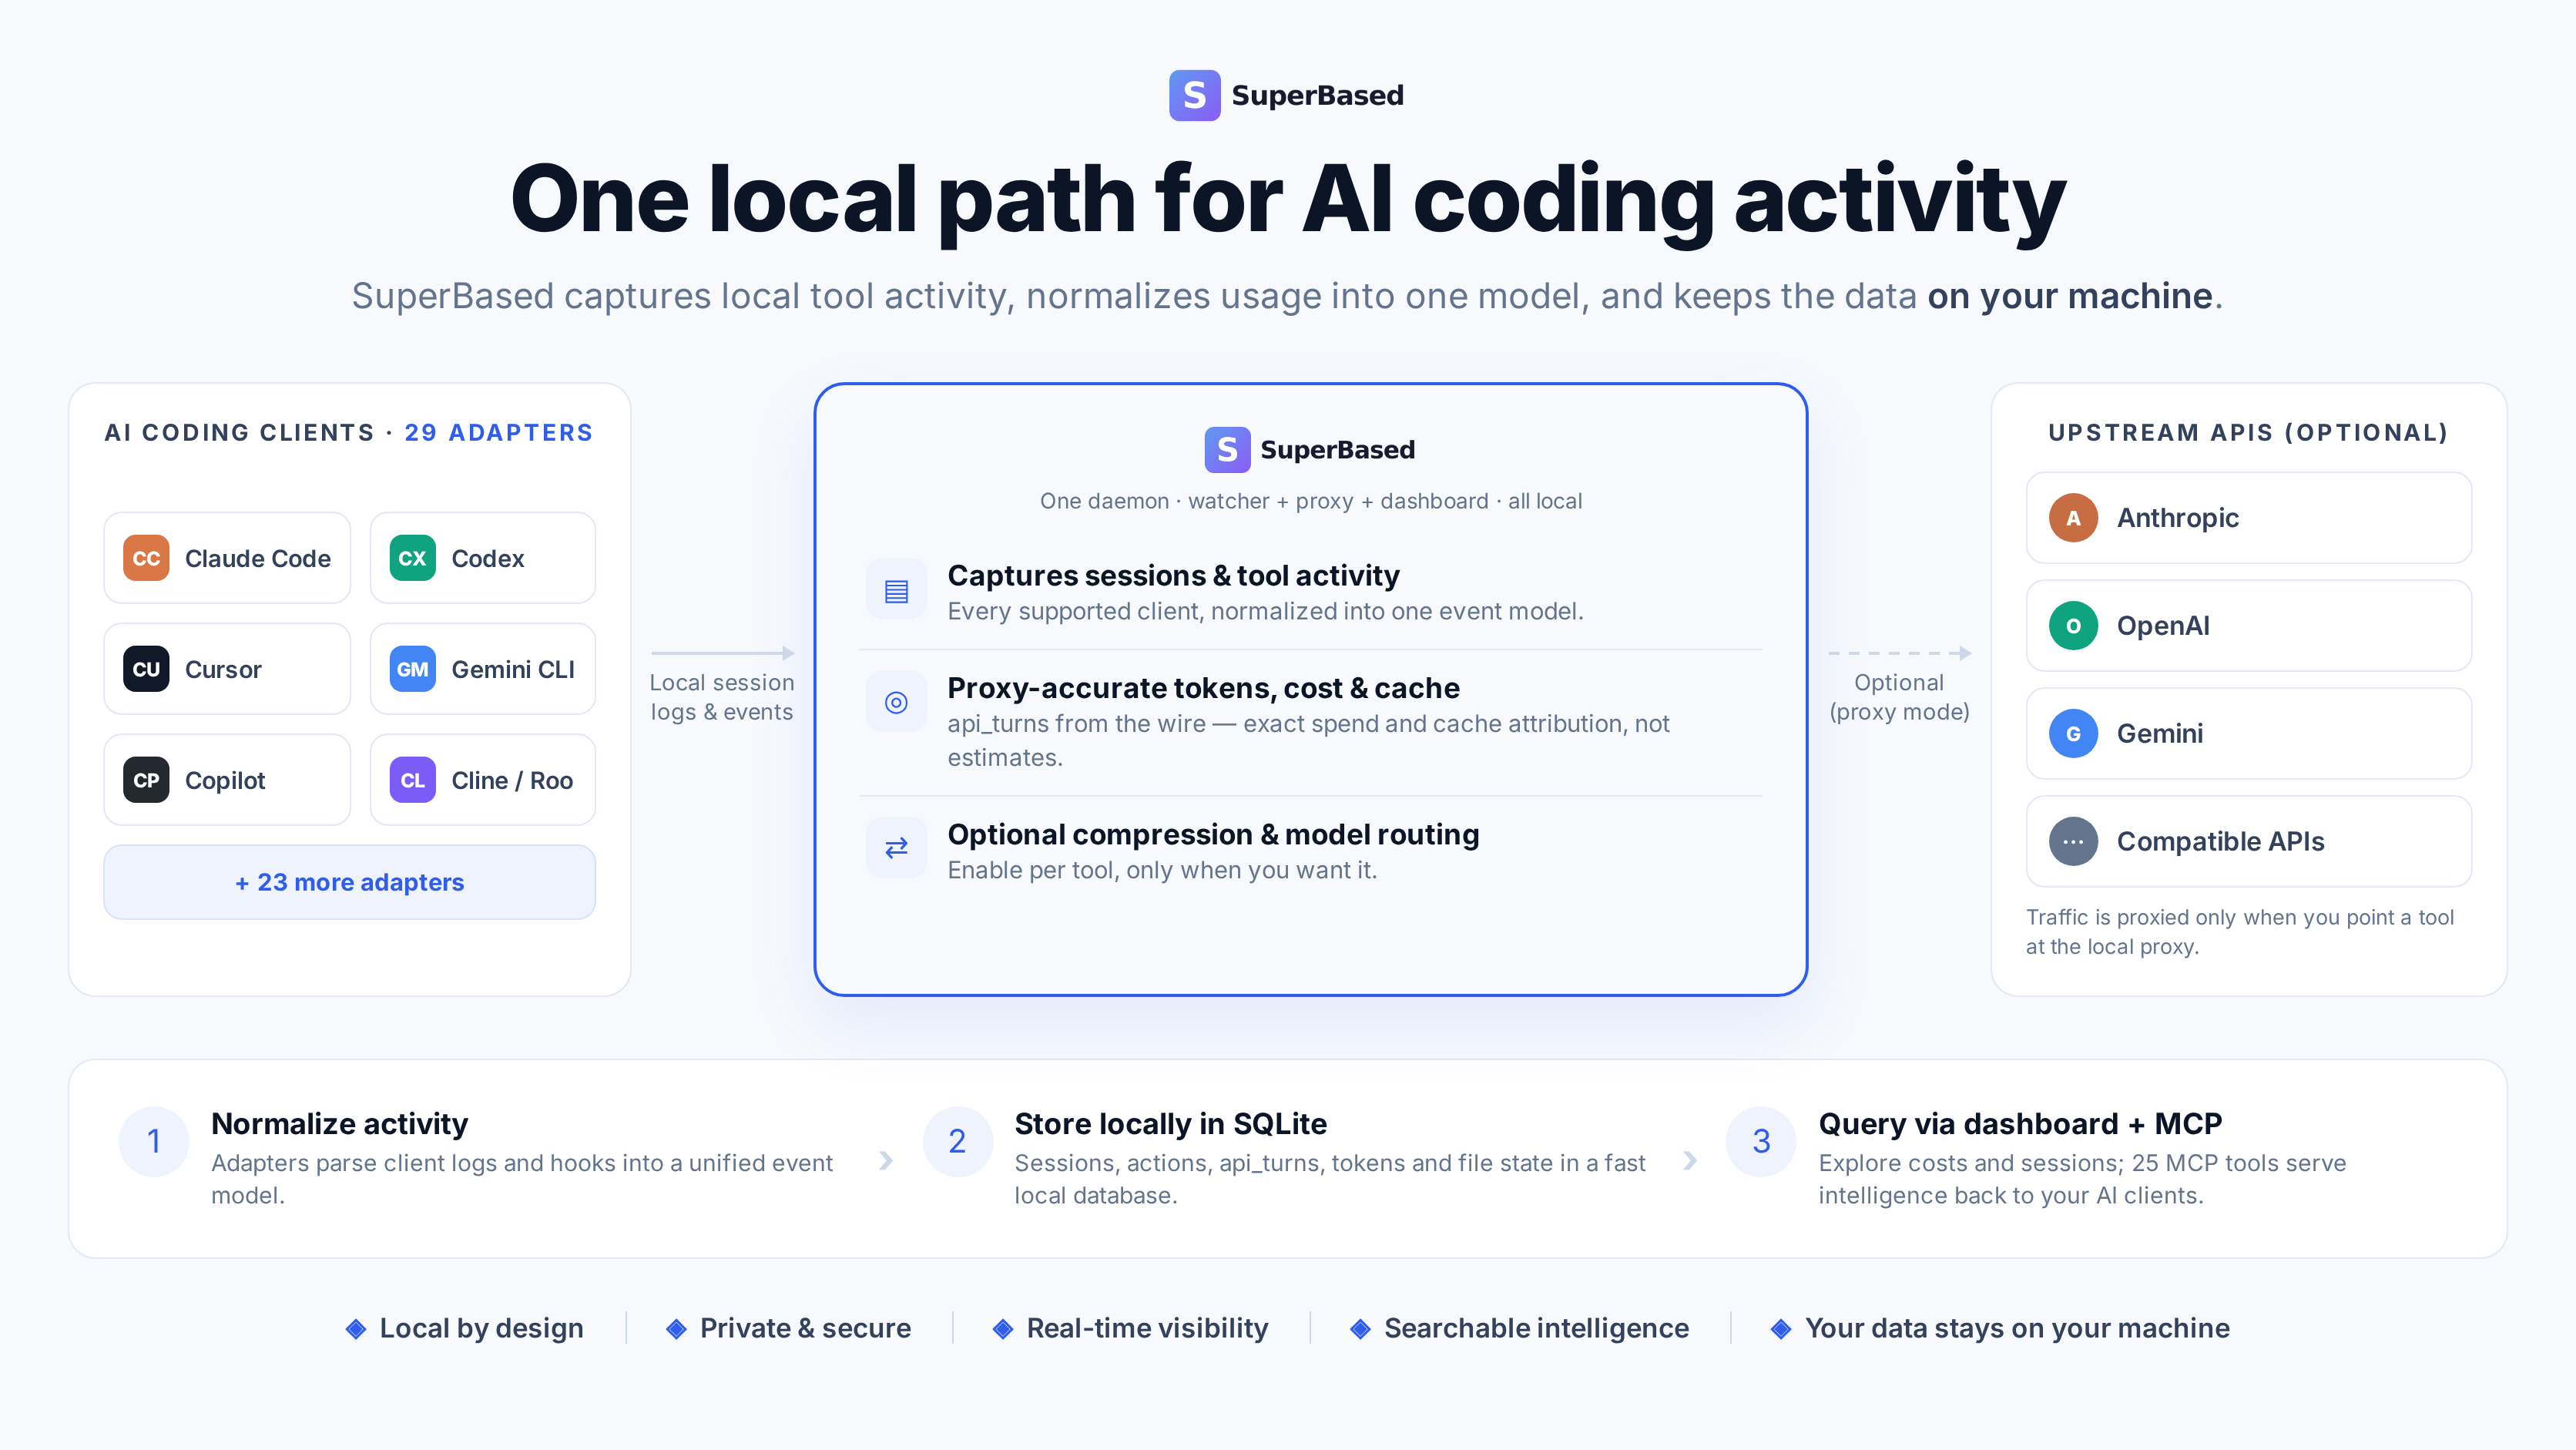
Local-first cost & token tracking for Claude Code, Cursor, Codex & 23 more AI coding agents — proxy-accurate per-model spend, an MCP server your agent can query, and an opt-in team rollup. 100% local, no telemetry.
Explore
- What it is in 30 seconds
- Install
- First-run walkthrough
- Dashboard tour
- MCP server — 25 cross-tool intelligence calls

Setting up with Highlight
This MCP is not yet compatible with Highlight’s one-click setup. However, you can still use it with Highlight by following these steps:
- Download and install Highlight from highlightai.com/download
- Navigate to the plugins tab and select "Add Custom Plugin"
-
Configure the plugin with the settings below
Plugin Name
Superbased ObserverCommand (node, npx, python, etc.)Please refer to the README for specific instructions on how to obtain API keys or other required environment variables.
- Enable "Start Automatically" if you want the plugin to start when Highlight launches





From the repository
Pick whichever package manager fits your environment — npm and PyPI
ship the same prebuilt binary from the same v* tag, version
numbers kept in lock-step.
go install github.com/marmutapp/superbased-observer/cmd/observer@latest
observer --version
``bash
observer doctor # health checks: DB integrity, hook
<p align="center">
</p>
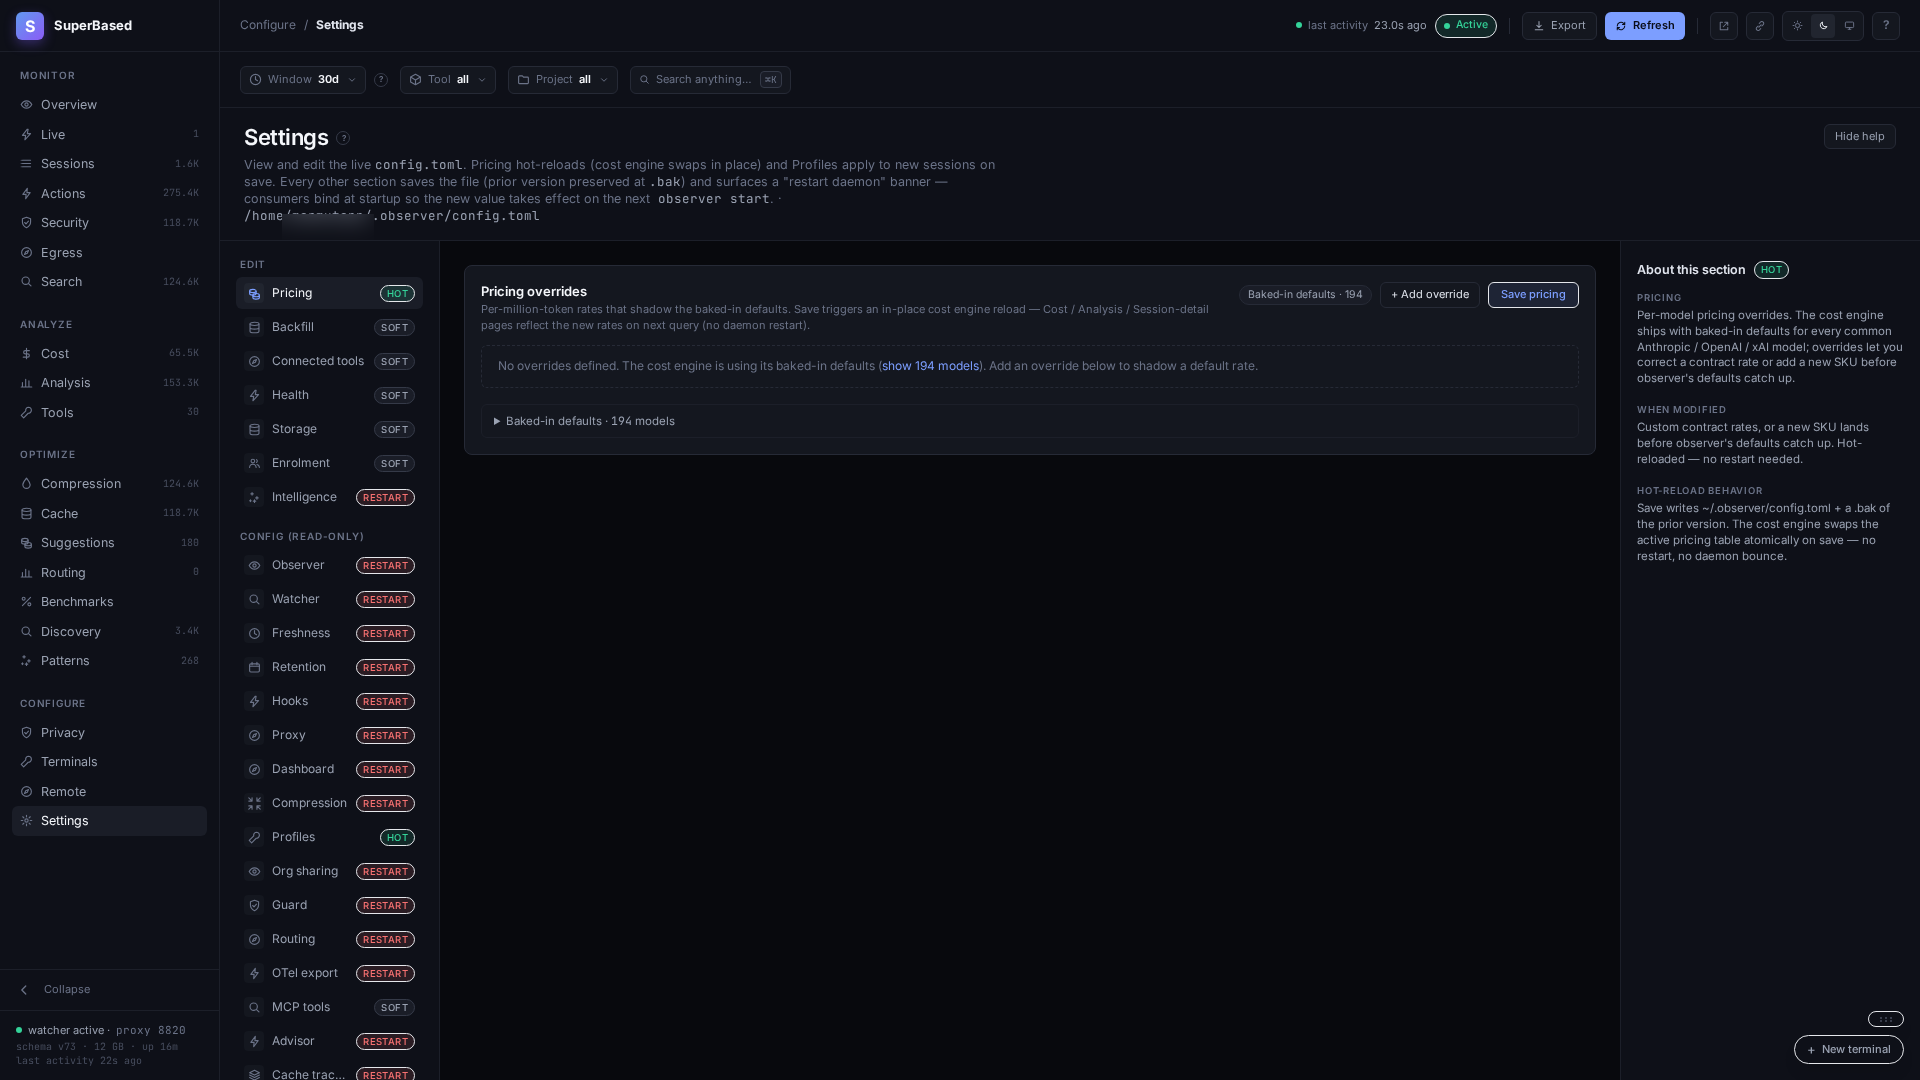
Schema-driven forms for every config section — Watcher, Freshness,
Retention, Hooks, Proxy, Compression, Intelligence, Advisor, Cache
tracking, Secrets scrubbing, MCP, Profiles, Org share, OTel — with
honest reload semantics per section: pricing and profile changes
apply hot, MCP applies to the next AI session, restart-gated
sections raise a persistent restart-pending banner that names the
exact command and clears only when the daemon actually restarts.
Alongside the forms: a Connected tools panel (per-tool status
matrix, consent-gated setup wizard, Launch button), a Health
panel (the observer doctor checks + recent failures), theobserver db
Backfill panel (every mode click-to-run with streamed output +
full rescan), a Storage panel (per-table DB size breakdown with
index/FTS bytes folded in, vacuum + online backup as click-to-run
jobs, documented manual restore — CLI twin
stats|vacuum|backup), and a config-file card with one-click .bak`
restore.
182 baked-in default models; pricing "Override" prompts auto-fill
from the default.
<p align="center">
</p>
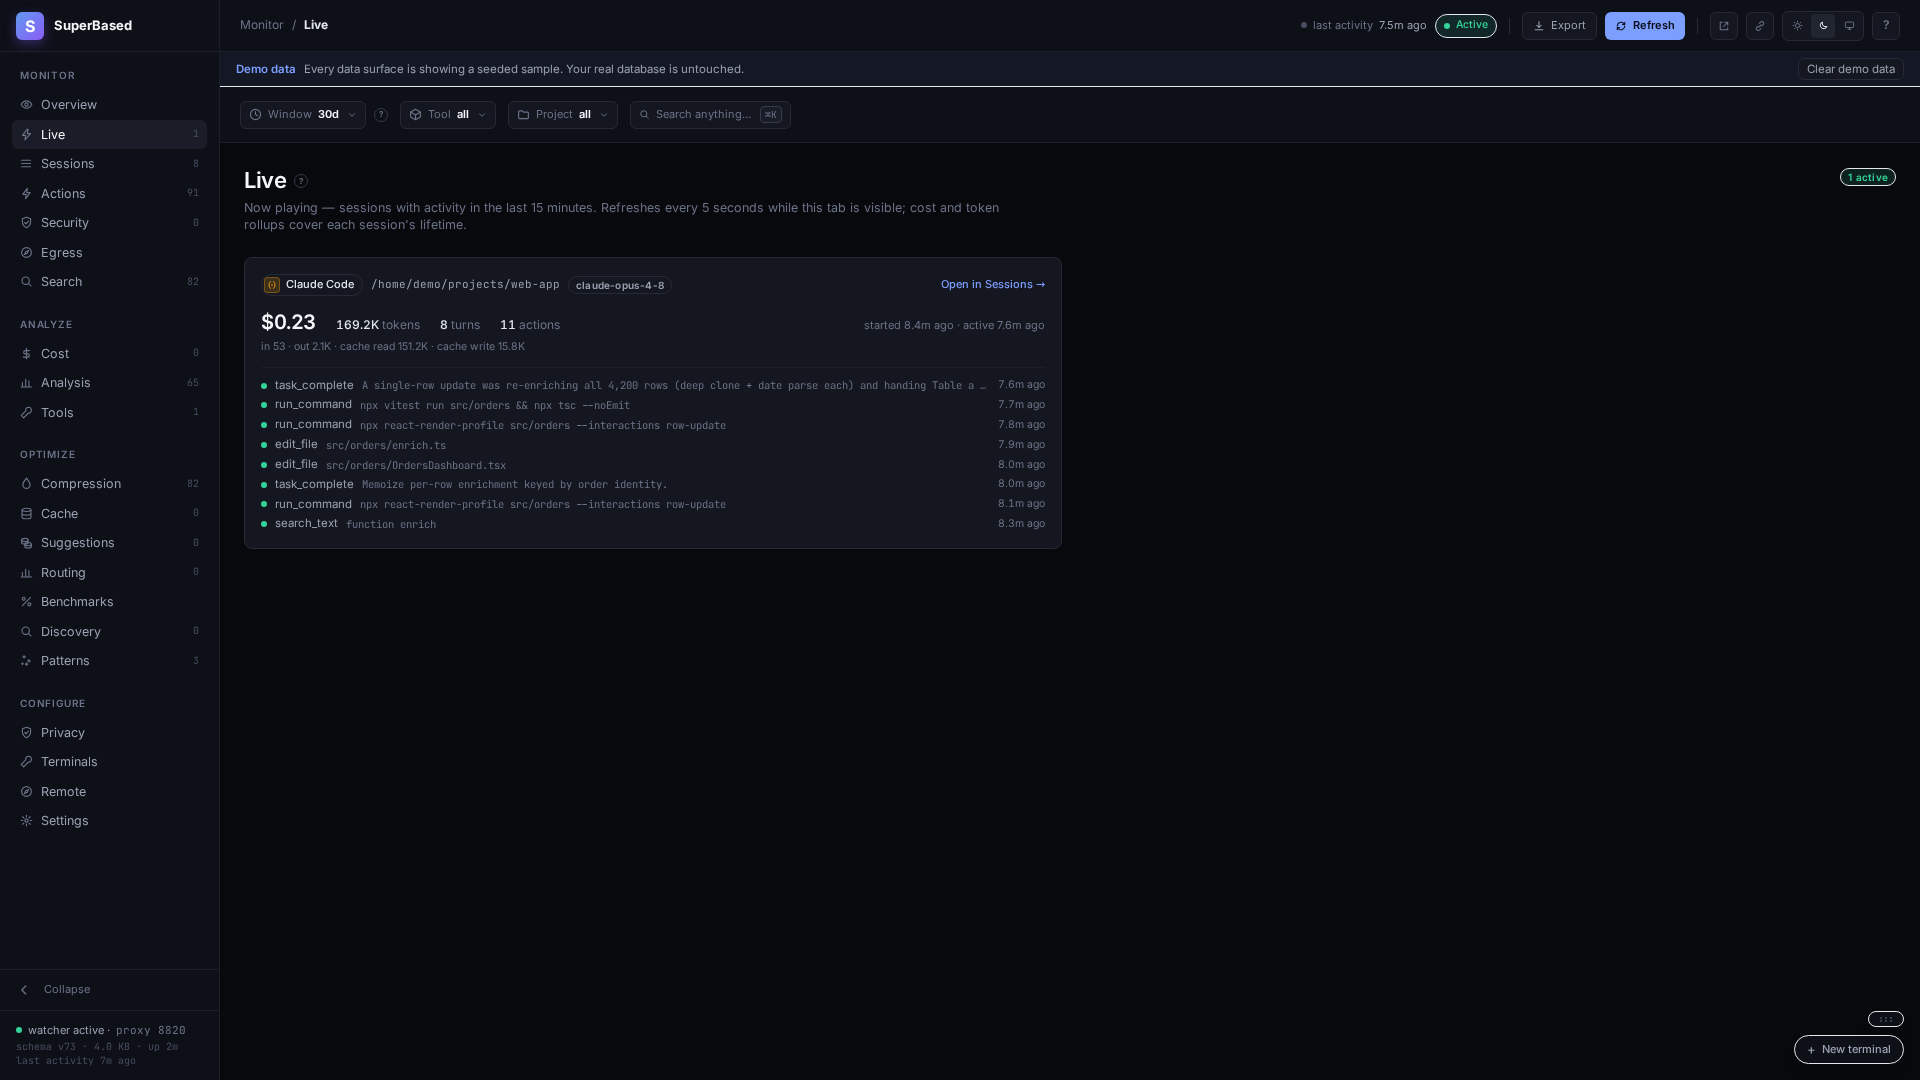
Every session with activity in the last 15 minutes, refreshing on a
5-second tick: lifetime cost, tokens, turns, and a streaming action
feed per session. The fastest way to confirm the proxy is capturing
while you work.
check_file_freshness
Has this file changed since I last read it?
check_command_freshness
Did this exact command already run? With what result?
get_file_history
Every read/edit of this file across every tool + session (with codeintel enrichment when available).
get_session_summary
What did session X actually do? AI-generated 2–4 sentence summaries.
get_session_recovery_context
For resuming an interrupted session.
get_project_patterns
Derived behaviours: hot files, co-changes, edit→test pairs.
get_last_test_result
Without re-running.
get_failure_context
Error correlation + retry detection.
get_action_details
The raw row, scrubbed of secrets.
get_cost_summary
Per-window spend rollup.
get_redundancy_report
What would Discovery flag for this project?
search_symbols
Fuzzy symbol search across the project's codeintel index (Tier-C).
list_actions_around
Chronological ±N actions around an `action_id`.
search_past_outputs
Full-text search of past tool-call outputs (FTS5 over excerpts).
get_output_composition
Code vs. explanation split of a session's output, by bytes, with the code:explanation ratio and languages used.
get_suggestions
Top dollar/time-quantified cost & quality suggestions from the local advisor.
cache_status
Live prompt-cache health: which caches are warm, expiring, or cold, with value-at-risk.
get_model_recommendation
Evidence-backed model suggestion per turn-kind, from the local Model Value Report.
get_routing_status
Model-routing layer state: phase, available policy templates, tier-table size, decision-log counters.
continue_session
A distilled, scrubbed handover of a session from another AI tool, so you can continue its work here.
get_session_message
One full, un-excerpted message from a session's transcript — pulls the complete body a handover excerpt truncated.
<p align="center">
</p>
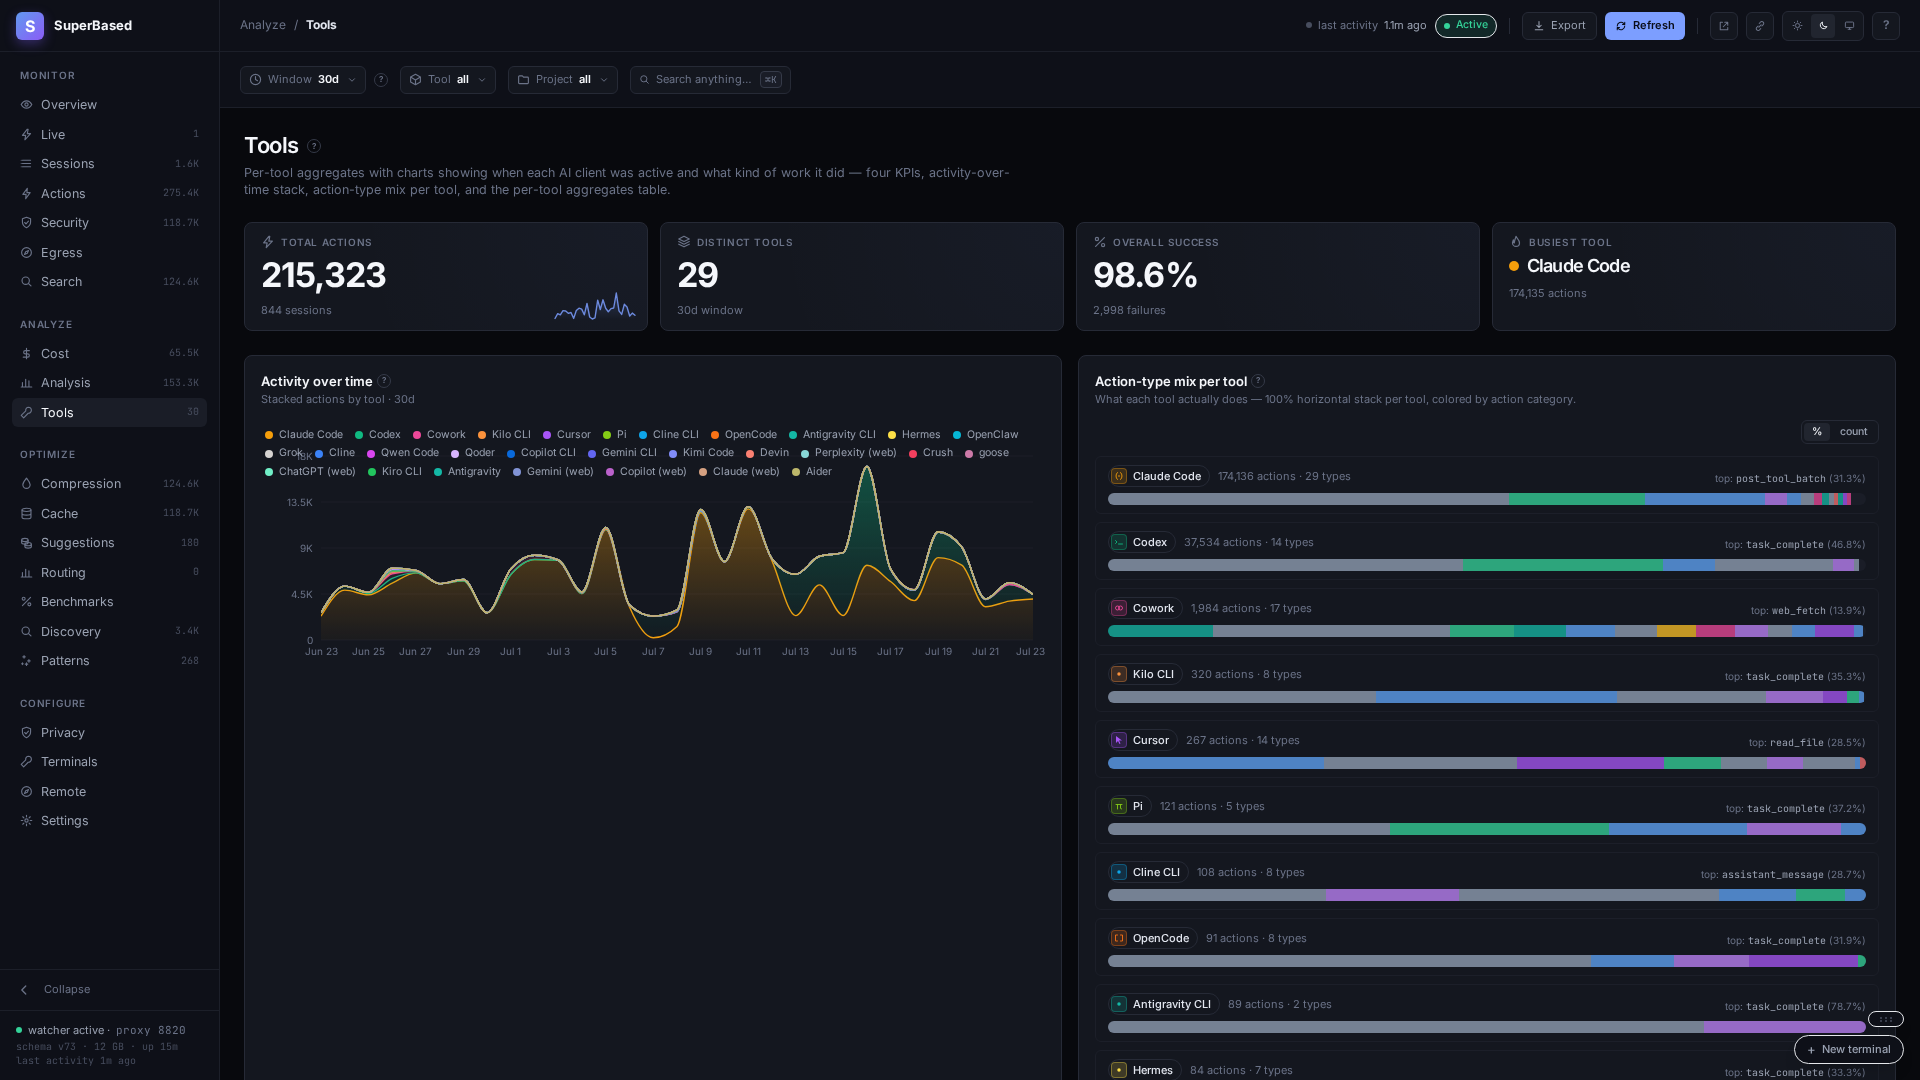
Four KPIs (total actions, distinct tools, overall success rate,
busiest tool), activity-over-time stacked area, and per-tool
action-type-mix horizontal bars (100% normalized, colored by action
category). Surfaces which AI client owned which kind of work.
Opt-in. The MCP server is not active until you run
observer init (or observer init --claude-code / --cursor /
--codex). That command writes entries pointing at the observer
binary into each AI tool's own MCP config file
(~/.claude.json, ~/.cursor/mcp.json, ~/.codex/config.toml).
The MCP server then runs as a stdio subprocess spawned by your AI
tool — its lifecycle matches the AI tool's, and it never opens a
network port. observer start alone does NOT register or launch
the MCP server; it can be skipped entirely via
observer init --skip-mcp if you want hooks-only capture.
Once registered, every connected AI tool can query the observer
over MCP/stdio: 21 tools are always registered, and 4 more
register conditionally (only when the capability they depend on —
the proxy stash, or the codeintel index — is actually configured):
| MCP tool | What it answers |
|---|---|
| check_file_freshness | Has this file changed since I last read it? |
| check_command_freshness | Did this exact command already run? With what result? |
| get_file_history | Every read/edit of this file across every tool + session (with codeintel enrichment when available). |
| get_session_summary | What did session X actually do? AI-generated 2–4 sentence summaries. |
| get_session_recovery_context | For resuming an interrupted session. |
| get_project_patterns | Derived behaviours: hot files, co-changes, edit→test pairs. |
| get_last_test_result | Without re-running. |
| get_failure_context | Error correlation + retry detection. |
| get_action_details | The raw row, scrubbed of secrets. |
| get_cost_summary | Per-window spend rollup. |
| get_redundancy_report | What would Discovery flag for this project? |
| search_symbols | Fuzzy symbol search across the project's codeintel index (Tier-C). |
| list_actions_around | Chronological ±N actions around an action_id. |
| search_past_outputs | Full-text search of past tool-call outputs (FTS5 over excerpts). |
| get_output_composition | Code vs. explanation split of a session's output, by bytes, with the code:explanation ratio and languages used. |
| get_suggestions | Top dollar/time-quantified cost & quality suggestions from the local advisor. |
| cache_status | Live prompt-cache health: which caches are warm, expiring, or cold, with value-at-risk. |
| get_model_recommendation | Evidence-backed model suggestion per turn-kind, from the local Model Value Report. |
| get_routing_status | Model-routing layer state: phase, available policy templates, tier-table size, decision-log counters. |
| continue_session | A distilled, scrubbed handover of a session from another AI tool, so you can continue its work here. |
| get_session_message | One full, un-excerpted message from a session's transcript — pulls the complete body a handover excerpt truncated. |
| get_file _(conditional)_ | The file's current bytes (or at a given commit), with path-safety gate + audit. |
| get_symbols _(conditional)_ | Resolve symbol name + range to file path + body (codeintel-backed). |
| get_relations _(conditional)_ | Codeintel BFS — who calls / is called by this symbol. |
| retrieve_stashed _(conditional)_ | Pulls original bytes of a tool_result the proxy stashed (only registered when CCR is enabled). |
Operator note for Claude Code via observer's proxy. When you set
ANTHROPIC_BASE_URL=http://localhost:8820, Claude Code's SDK
disables ToolSearch:optimistic deferred MCP loading — observer's
tool schemas (plus any Google MCPs you've registered) end up
eagerly inlined into every request prefix, ~+21K tokens/turn. Set
ENABLE_TOOL_SEARCH=true in the same shell to recover lazy
loading; observer's proxy forwards tool_reference blocks
byte-identically, satisfying the SDK's documented safety condition
for the override. See
superbased.app/docs/connect/claude-code
for the full picture.
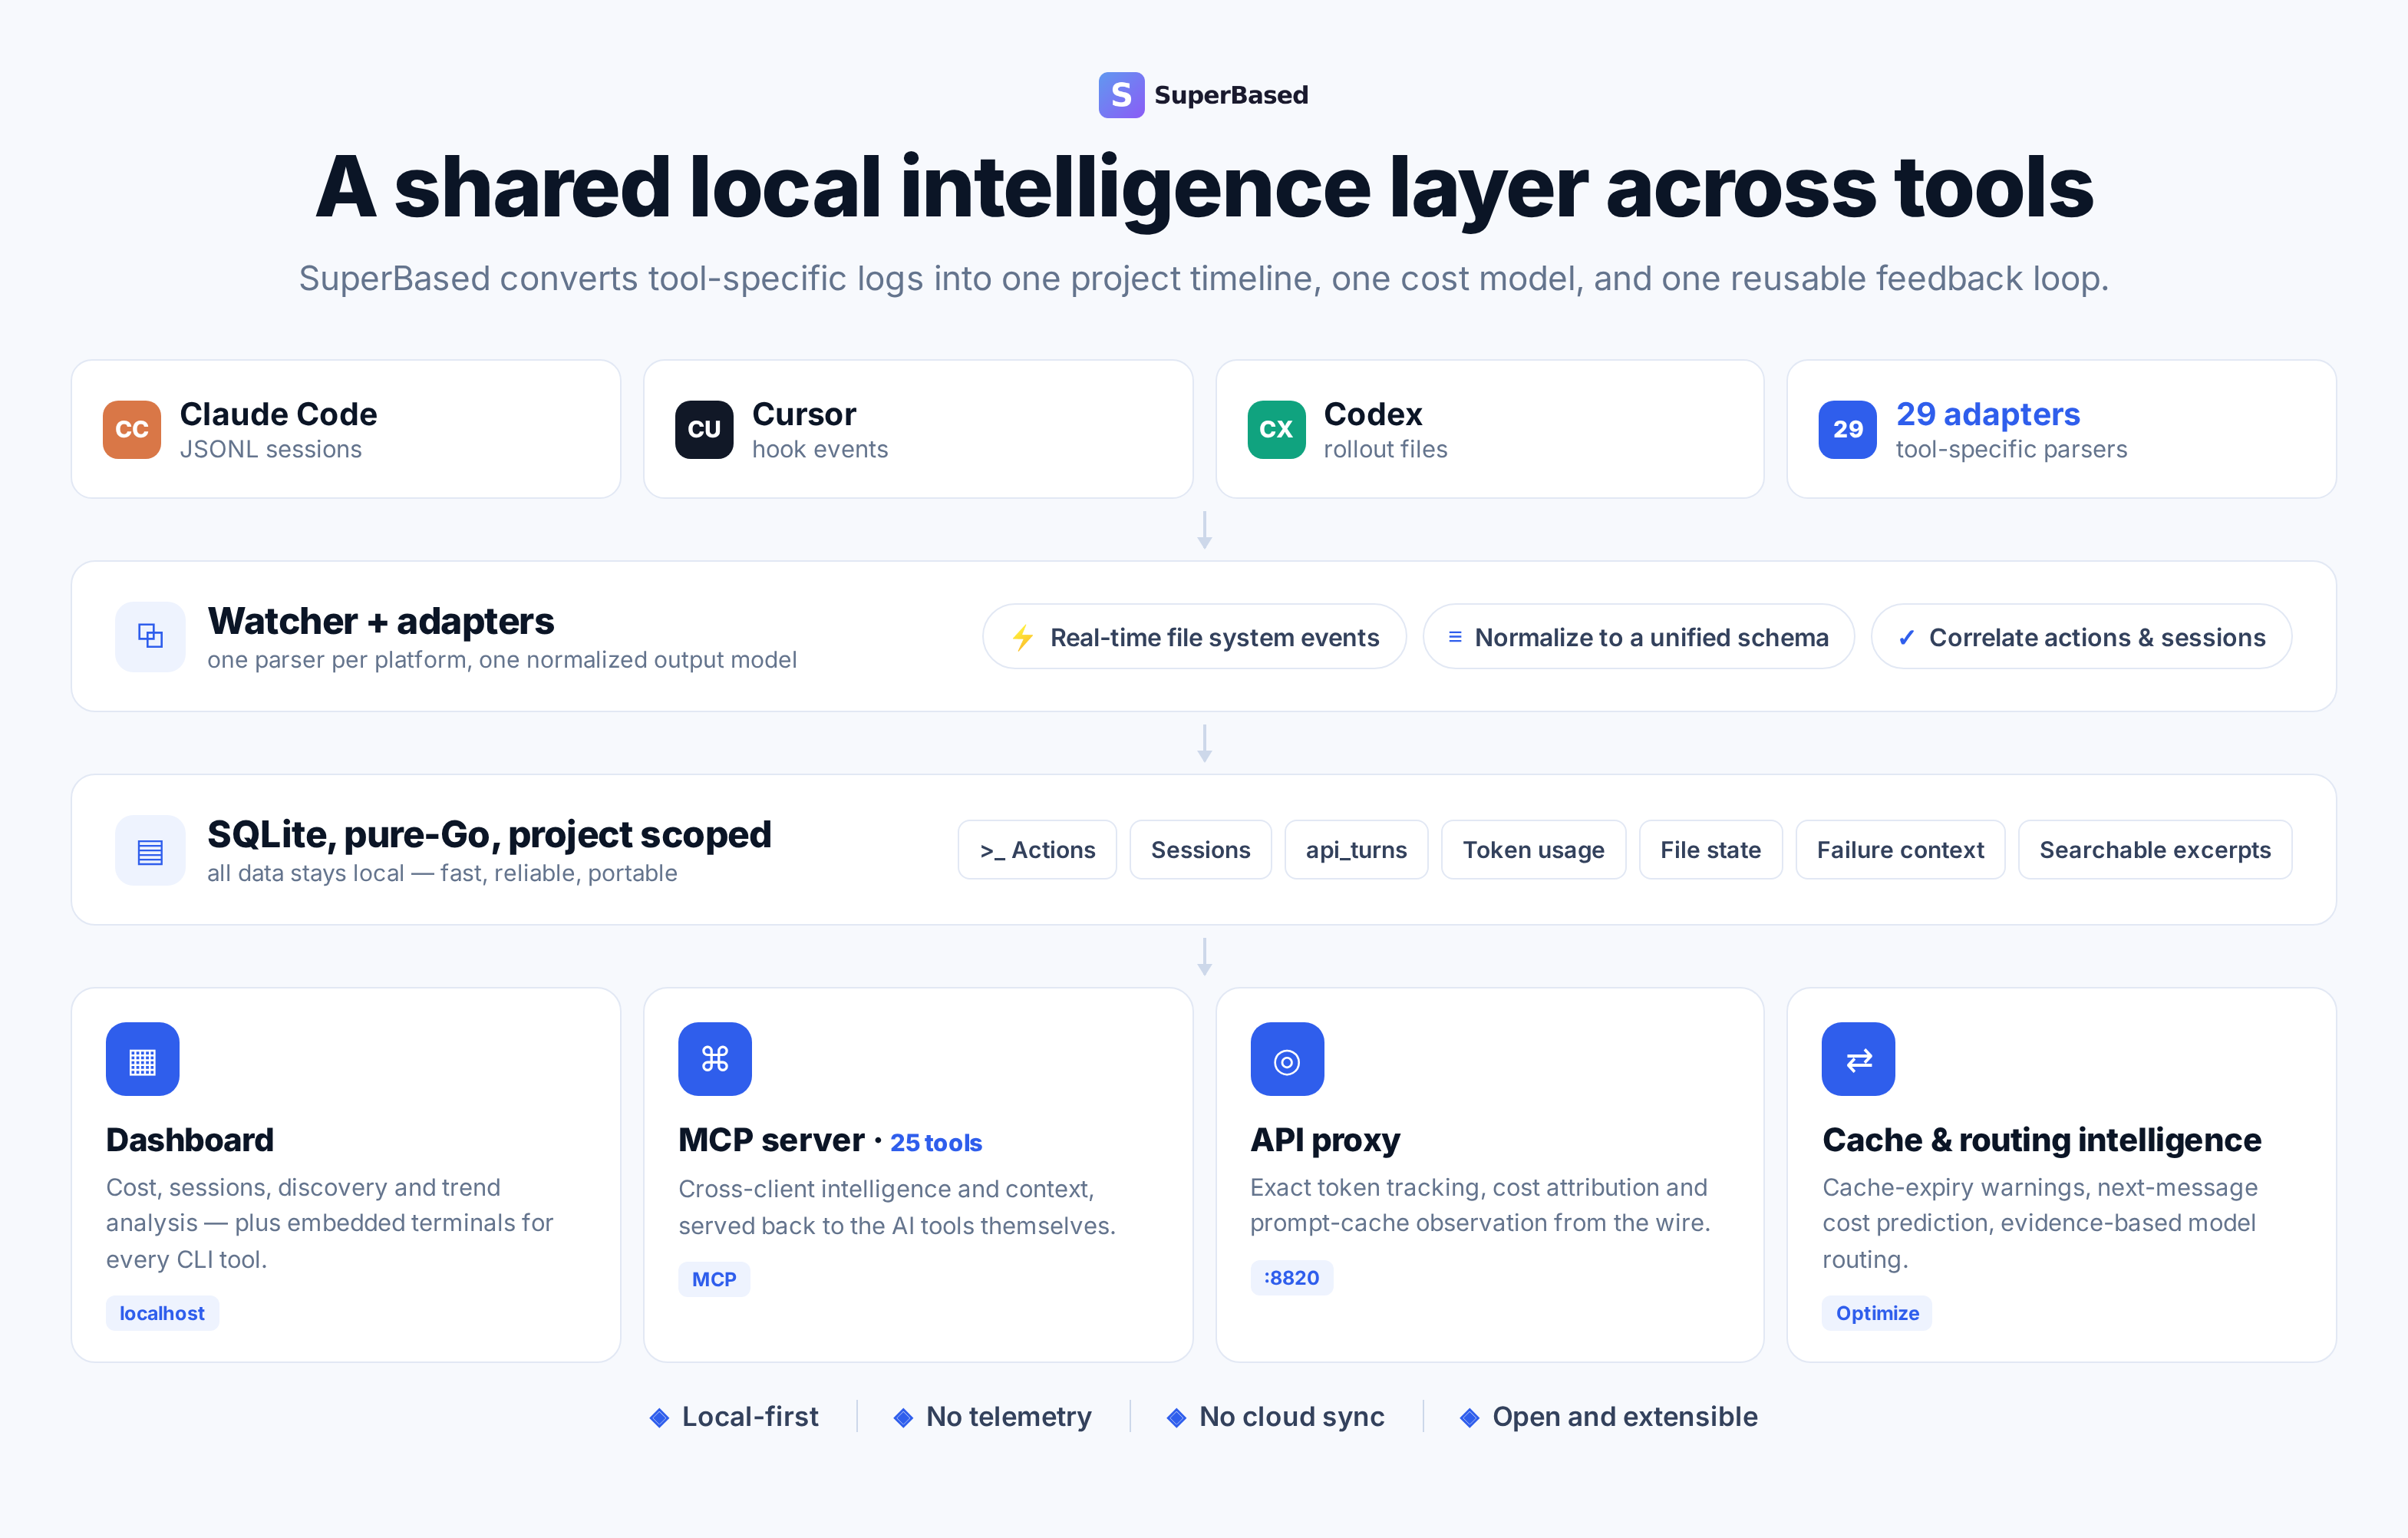
Knowledge captured from one tool benefits all the others working on
the same project — data is organized by git root, not by tool. A
read by Claude Code becomes a freshness signal for Codex; a Cursor
compaction is visible from Cline.
---
Claude Desktop / Cursor
Paste into your MCP client config file to install this server.
{
    "mcpServers": {
        "superbased observer": {
            "superbased-observer": {
                "command": "uv",
                "args": [
                    "tool",
                    "install",
                    "superbased-observer",
                    "#",
                    "uv",
                    "(isolated",
                    "env,",
                    "fastest)"
                ]
            }
        }
    }
}McpServers
{
"superbased-observer": {
"command": "uv",
"args": [
"tool",
"install",
"superbased-observer",
"#",
"uv",
"(isolated",
"env,",
"fastest)"
]
}
}> The exact tokens your AI provider billed you — cache splits,
> reasoning tokens, long-context surcharges — reconciled across 26
> coding tools, entirely on your own machine. Nothing you build here
> ever leaves your machine unless you opt a node into it.




<p align="center">
</p>
---
Table of contents
- What it is in 30 seconds
- Install
- First-run walkthrough
- Dashboard tour
- MCP server — 25 cross-tool intelligence calls
- API proxy — accurate token capture + compression
- Architecture
- Teams & Org Visibility
- Security & control layer (guard)
- CLI reference
- Configuration
- Post-upgrade hygiene + recovery
- Build from source
- Contributing
- License
---
What it is in 30 seconds
A single local Go binary built on three things a hosted usage console
can't give you, in order of how much they matter:
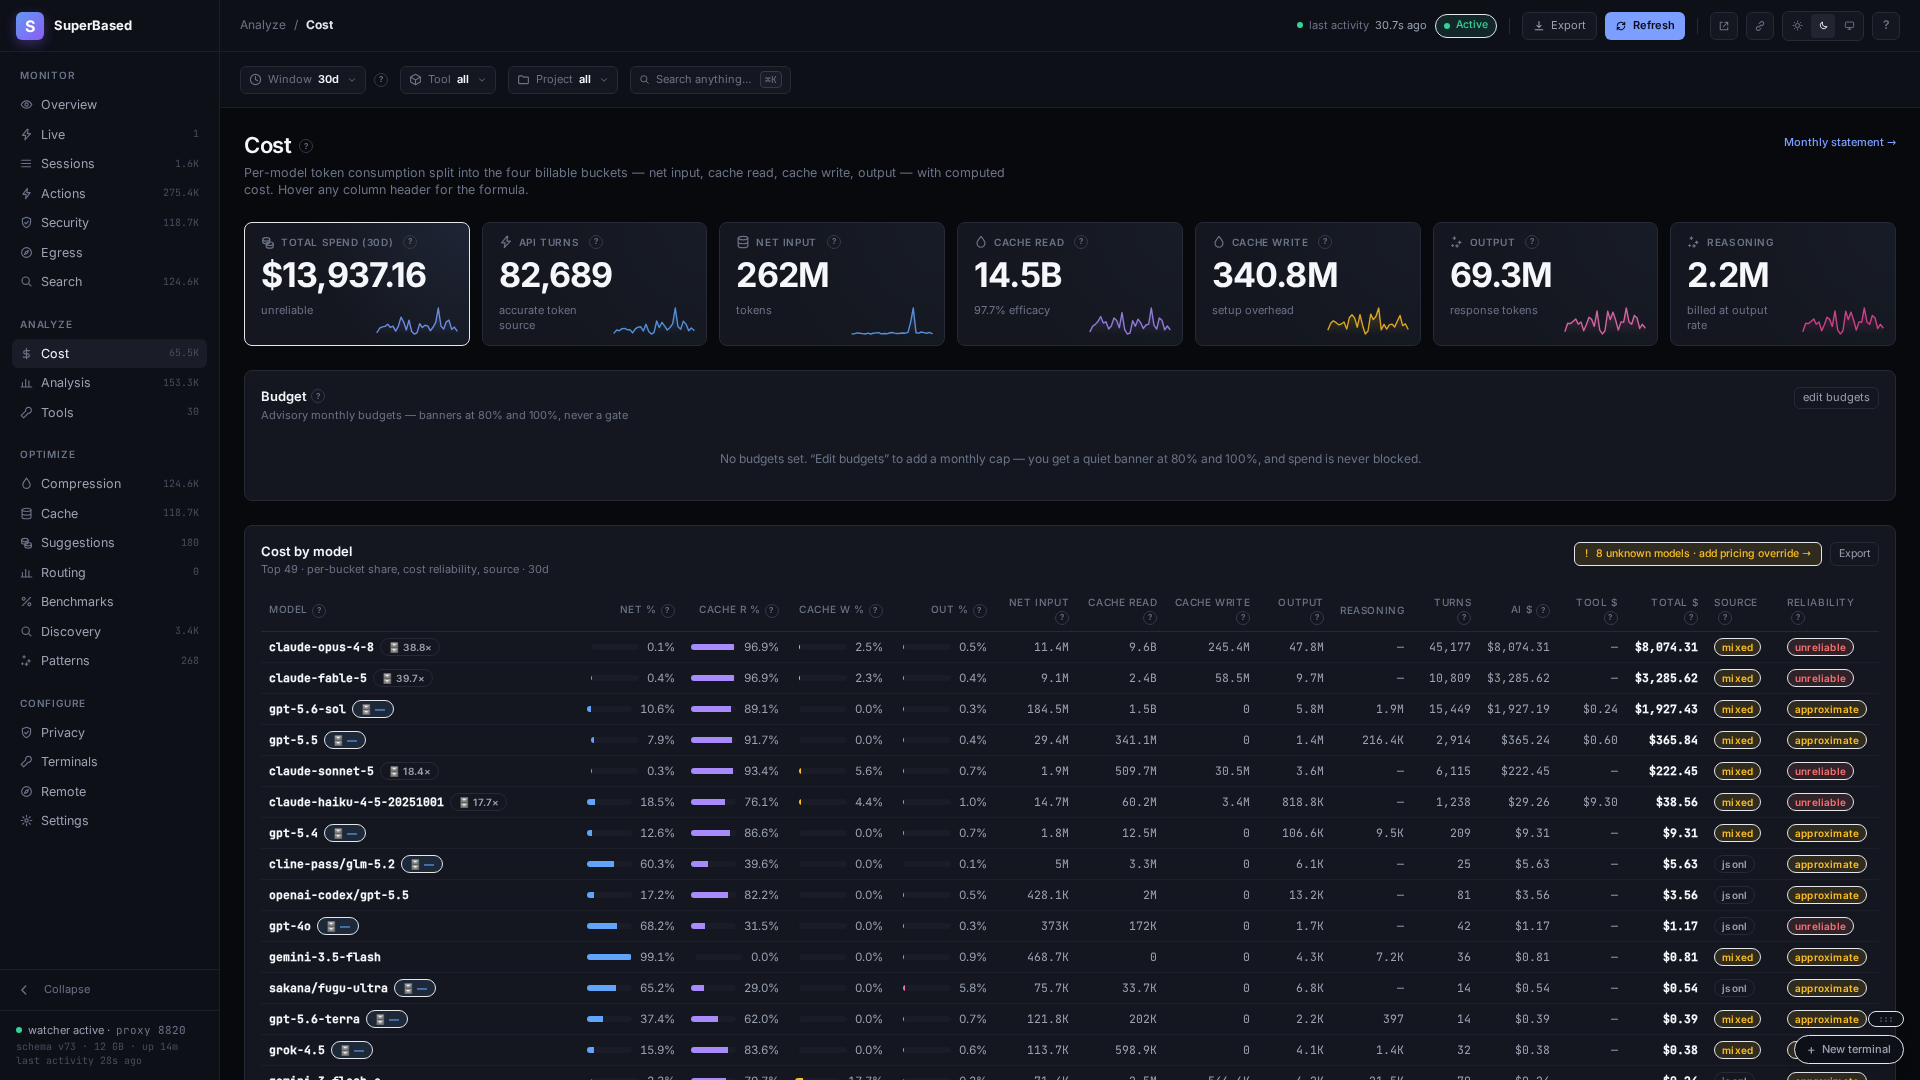
1. Proxy-accurate, cross-vendor cost attribution. An optional API
reverse proxy reads the token counts your provider actually
billed — net input, 5m/1h cache read/write splits, reasoning
tokens, long-context repricing — the same math your invoice uses,
not a JSONL-derived estimate. It's accurate enough that it caught
its own bug: a Codex reasoning-token double-billing regression
Observer found and back-corrected months of history for
(migration 058, shipped v1.18.0) — the kind of self-audit a vendor
console has no incentive to run against itself.
2. Local-first, by construction. The watcher, proxy, dashboard,
MCP server, and CLI make zero outbound calls on your behalf — no
telemetry, no analytics, no remote reporting. An optional team
rollup server ships only hashed metadata by default; raw content
ships only when the node opts in, never a remote admin toggle.
Full details: PRIVACY.md.
3. One capture layer, every tool you actually use. 26 adapters —
Claude Code, Codex, Cursor, Cline + Cline CLI, GitHub Copilot +
Copilot CLI, Gemini CLI, OpenCode, Google Antigravity, Cowork,
Hermes Agent, Kilo Code, Aider, Goose, Devin, Qoder, Crush, Grok,
Kiro CLI, Kimi Code, Qwen Code, OpenClaw, Pi, and more — parsed
into one normalized schema, queryable from a local dashboard, an
MCP server (so the tools themselves can query it), and a CLI.
(Five of the 26 are -web adapters for ChatGPT/Claude.ai/Gemini/
Copilot/Perplexity in the browser — those need the browser-capture
extension, which today only installs unpacked; every tool listed
above works out of the box.)
Raw token counting across tools is table stakes here — it's the
substrate the accurate-cost layer above is built on, not the pitch.
Two planes, one binary. Plane B is coding-agent observability
— desktop-first: capture, proxy-accurate cost, compression, cache
tracking, and session handoff for every AI coding tool on your
machine, with an optional team rollup server for org-wide spend.
Plane A is general LLM-app observability — admin-server-first:
OTLP trace/span capture, evals, and an LLM-as-judge input-admission
guardrail for an application you host, whose end users route
through Observer. Most solo developers only ever touch Plane B; teams
add Plane A when they're also running an LLM-powered product. Full
explainer: superbased.app/docs/getting-started/two-planes
(or docs/deployment-models.md if you're reading this in the repo).
<p align="center">
</p>
<p align="center">
</p>
<p align="center">
</p>
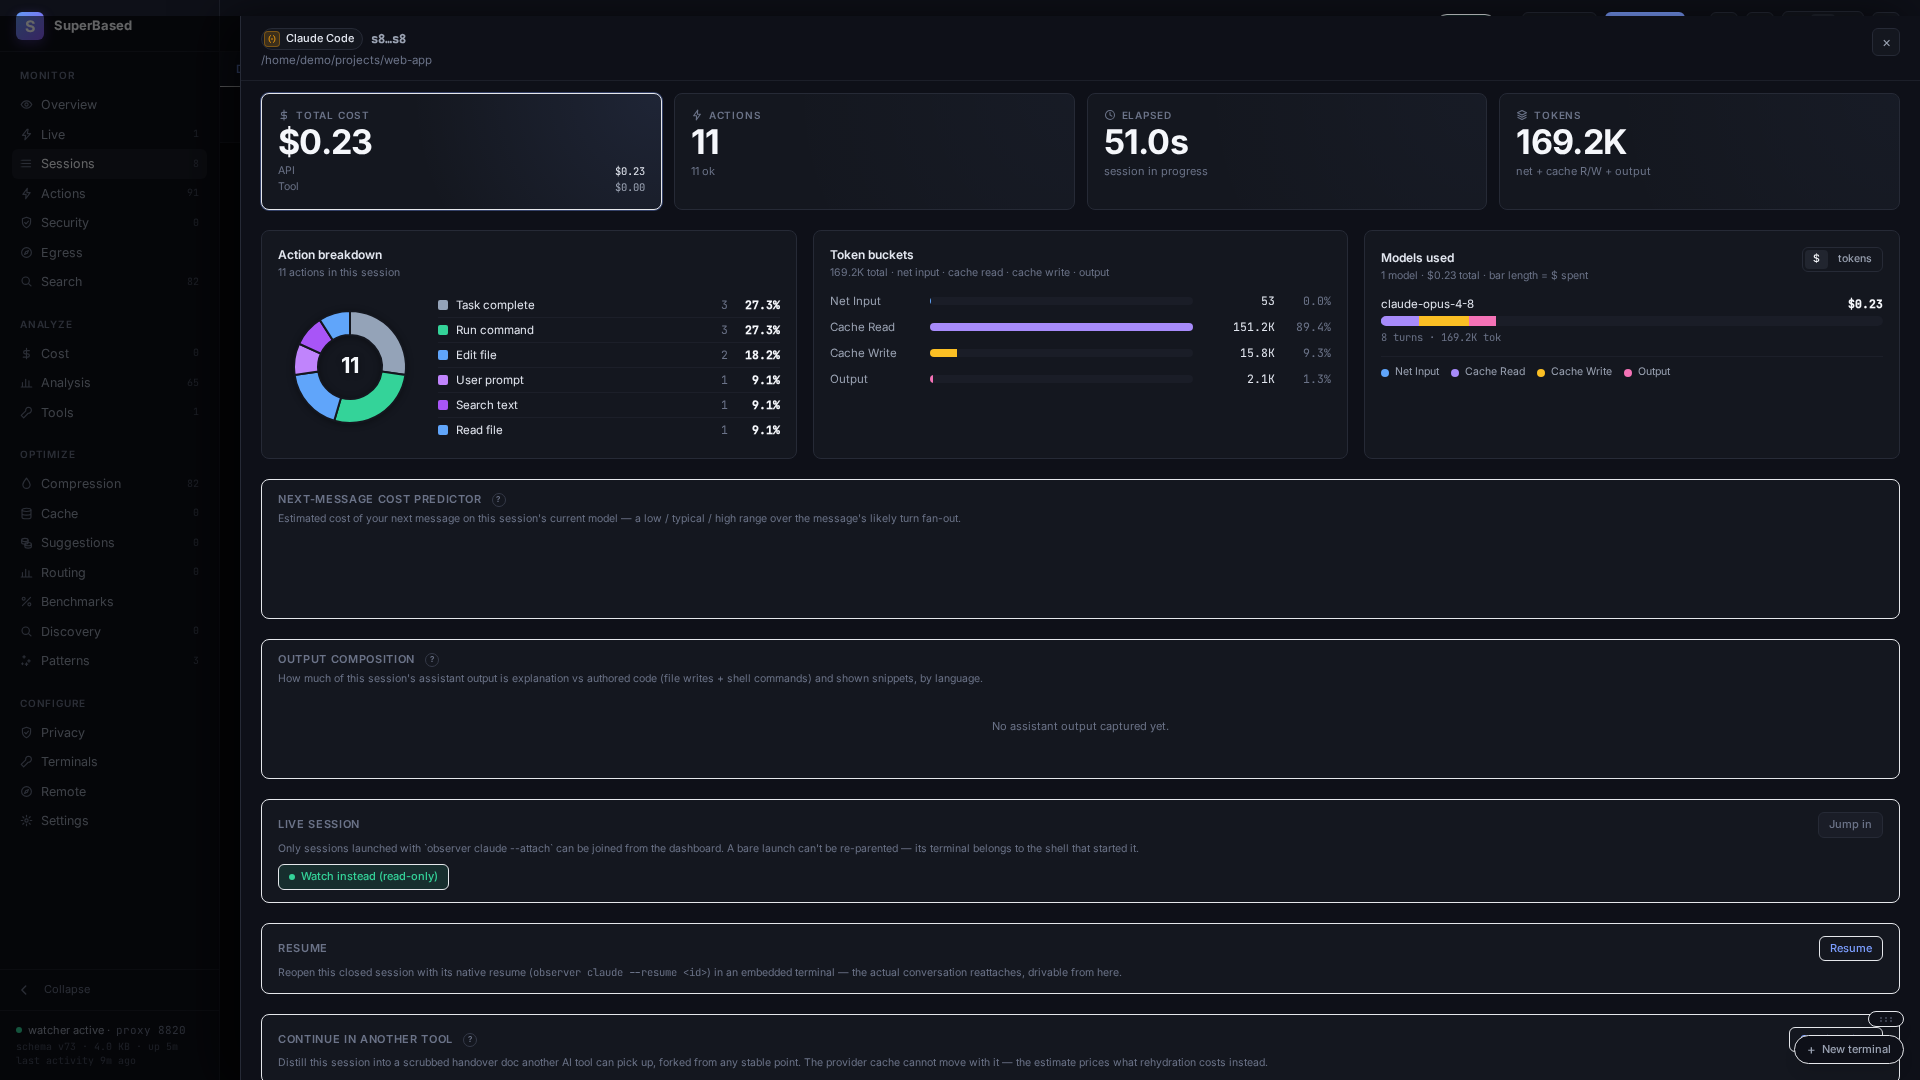
It answers questions like:
- Where did this week's $147 Claude bill come from — which projects,
models, sessions, tool calls? And is that number the same one my
provider's invoice would show?
- Did I spend more on Opus or Sonnet? Are my Sonnet sessions hitting
the long-context tier and getting repriced at 2×?
- How much did I waste re-reading files that hadn't changed since
the last read in the same session?
- Could that trivial Opus session have been done by Sonnet for 1/5
the cost?
- Across Claude Code, Cursor, and Codex working in the same repo,
what files are touched by all three? Where are they stepping on
each other?
- What will my next message roughly cost — and how much of my 5-hour
and weekly subscription limit is left before I hit it?
- Where did my own OpenTelemetry-instrumented agent spend its tokens
— with the proxy's exact per-span cost where it routed through the
proxy?
---
Install
Pick whichever package manager fits your environment — npm and PyPI
ship the same prebuilt binary from the same v tag, version
numbers kept in lock-step.
Via VS Code (Marketplace or Open VSX)
code --install-extension superbased.superbased-observer
The VS Code extension bundles the observer binary, lifts the
dashboard / sidebar / status bar / file decorations into the editor,
and contributes a terminal profile that pre-exports the proxy env
vars so AI CLIs launched from it route through observer
automatically. Cursor, VSCodium, and Windsurf install the same VSIX
via Open VSX.
After install, VS Code's Get Started page surfaces an in-editor
walkthrough; the long-form user guide lives at
docs/vscode-extension-user-guide.md
and the command + settings reference is at
docs/vscode-extension.md.
Via npm (recommended for Node users)
npm install -g @superbased/observer
observer --version
Via pip / uv / pipx (recommended for Python users)
pip install superbased-observer # plain pip
uv tool install superbased-observer # uv (isolated env, fastest)
pipx install superbased-observer # pipx (isolated env)
observer --version
Wheels ship for manylinux2014_{x86_64,aarch64},
macosx_*_{x86_64,arm64}, and win_amd64. uv tool and pipx
keep the install isolated from your project's Python env — generally
what you want for a CLI tool.
Via go install (latest main, builds locally)
go install github.com/marmutapp/superbased-observer/cmd/observer@latest
observer --version
Via direct download (pre-built per-platform archive)
Each tagged release attaches per-platform archives to the
Releases page,
verifiable against the published SHA256SUMS:
| Asset | Platform | Contents |
|---|---|---|
| observer-vX.Y.Z-linux-x64.tar.gz | Linux x86_64 | observer + antigravity-bridge.exe (for WSL2) |
| observer-vX.Y.Z-linux-arm64.tar.gz | Linux arm64 | observer + antigravity-bridge.exe (for WSL2) |
| observer-vX.Y.Z-darwin-x64.tar.gz | macOS Intel | observer |
| observer-vX.Y.Z-darwin-arm64.tar.gz | macOS Apple Silicon | observer |
| observer-vX.Y.Z-win32-x64.zip | Windows x86_64 | observer.exe |
| SHA256SUMS | — | sha256 of all five archives |
```bash
Sign in to leave a review
Use Google, GitHub, or an email account so ratings stay tied to real people.
No reviews posted yet.