
Vizro MCP
About
MCP server to help with chat and dashboard creation.
Explore
- Build beautiful multi-page apps with low-code configuration.
- In-built visual design best practices.
- Powered by trusted open-source packages: Plotly, Dash, Pydantic.
- Extendable with Python, JavaScript, HTML, and CSS code.
- Rapid prototyping to production deployment.
- Includes Vizro-AI for generating charts/dashboards via LLMs.

Setting up with Highlight
This MCP is not yet compatible with Highlight’s one-click setup. However, you can still use it with Highlight by following these steps:
- Download and install Highlight from highlightai.com/download
- Navigate to the plugins tab and select "Add Custom Plugin"
-
Configure the plugin with the settings below
Plugin Name
Vizro MCPCommand (node, npx, python, etc.)Please refer to the README for specific instructions on how to obtain API keys or other required environment variables.
- Enable "Start Automatically" if you want the plugin to start when Highlight launches





From the repository
pip install vizro
See the installation guide for more information.
The get started documentation explains how to create your first dashboard.
get_vizro_chart_or_dashboard_plan
Get instructions for creating a Vizro chart or dashboard. Call FIRST when asked to create Vizro things. Must be ALWAYS called FIRST with advanced_mode=False, then call again with advanced_mode=True if the JSON config does not suffice anymore. Args: user_plan: The type of Vizro thing the user wants to create user_host: The host the user is using, if "ide" you can use the IDE/editor to run python code advanced_mode: Only call if you need to use custom CSS, custom components or custom actions. No need to call this with advanced_mode=True if you need advanced charts, use `custom_charts` in the `validate_dashboard_config` tool instead. Returns: Instructions for creating a Vizro chart or dashboard
get_model_json_schema
Get the JSON schema for the specified Vizro model. Args: model_name: Name of the Vizro model to get schema for (e.g., 'Card', 'Dashboard', 'Page') Returns: JSON schema of the requested Vizro model
get_sample_data_info
If user provides no data, use this tool to get sample data information. Use the following data for the below purposes: - iris: mostly numerical with one categorical column, good for scatter, histogram, boxplot, etc. - tips: contains mix of numerical and categorical columns, good for bar, pie, etc. - stocks: stock prices, good for line, scatter, generally things that change over time - gapminder: demographic data, good for line, scatter, generally things with maps or many categories Args: data_name: Name of the dataset to get sample data for Returns: Data info object containing information about the dataset.
load_and_analyze_data
Use to understand local or remote data files. Must be called with absolute paths or URLs. Supported formats: - CSV (.csv) - JSON (.json) - HTML (.html, .htm) - Excel (.xls, .xlsx) - OpenDocument Spreadsheet (.ods) - Parquet (.parquet) Args: path_or_url: Absolute (important!) local file path or URL to a data file Returns: DataAnalysisResults object containing DataFrame information and metadata
validate_dashboard_config
Validate Vizro model configuration. Run ALWAYS when you have a complete dashboard configuration. If successful, the tool will return the python code and, if it is a remote file, the py.cafe link to the chart. The PyCafe link will be automatically opened in your default browser if auto_open is True. Args: dashboard_config: Either a JSON string or a dictionary representing a Vizro dashboard model configuration data_infos: List of DFMetaData objects containing information about the data files custom_charts: List of ChartPlan objects containing information about the custom charts in the dashboard auto_open: Whether to automatically open the PyCafe link in a browser Returns: ValidationResults object with status and dashboard details
validate_chart_code
Validate the chart code created by the user and optionally open the PyCafe link in a browser. Args: chart_config: A ChartPlan object with the chart configuration data_info: Metadata for the dataset to be used in the chart auto_open: Whether to automatically open the PyCafe link in a browser Returns: ValidationResults object with status and dashboard details



Documentation | Get Started | Vizro examples gallery
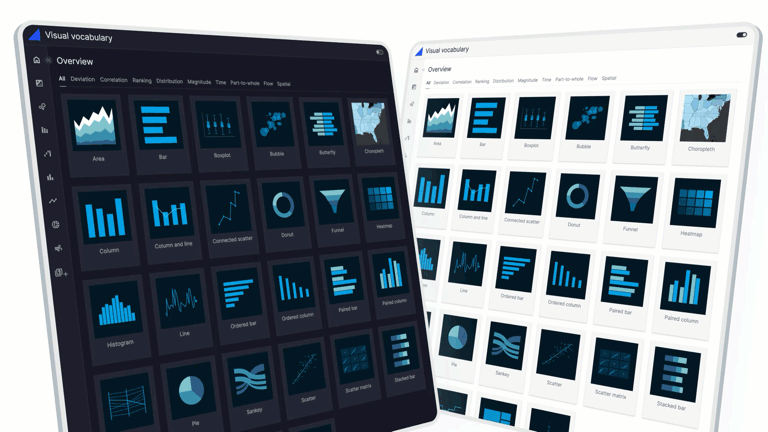
<picture>
<source srcset="https://raw.githubusercontent.com/mckinsey/vizro/main/.github/images/vizro_spash_teaser.gif">
</picture>
<br>
<br>
</div>
Claude Desktop / Cursor
Paste into your MCP client config file to install this server.
{
    "mcpServers": {
        "vizro mcp": {
            "vizro-mcp": {
                "command": "uvx",
                "args": [
                    "vizro-mcp"
                ]
            }
        }
    }
}McpServers
{
    "vizro-mcp": {
        "command": "uvx",
        "args": [
            "vizro-mcp"
        ]
    }
}
What is Vizro?
Vizro is an open-source Python-based toolkit.
Use it to build beautiful and powerful data visualization apps quickly and easily, without needing advanced engineering or visual design expertise.
Then customize and deploy your app to production at scale.
<div align="center">
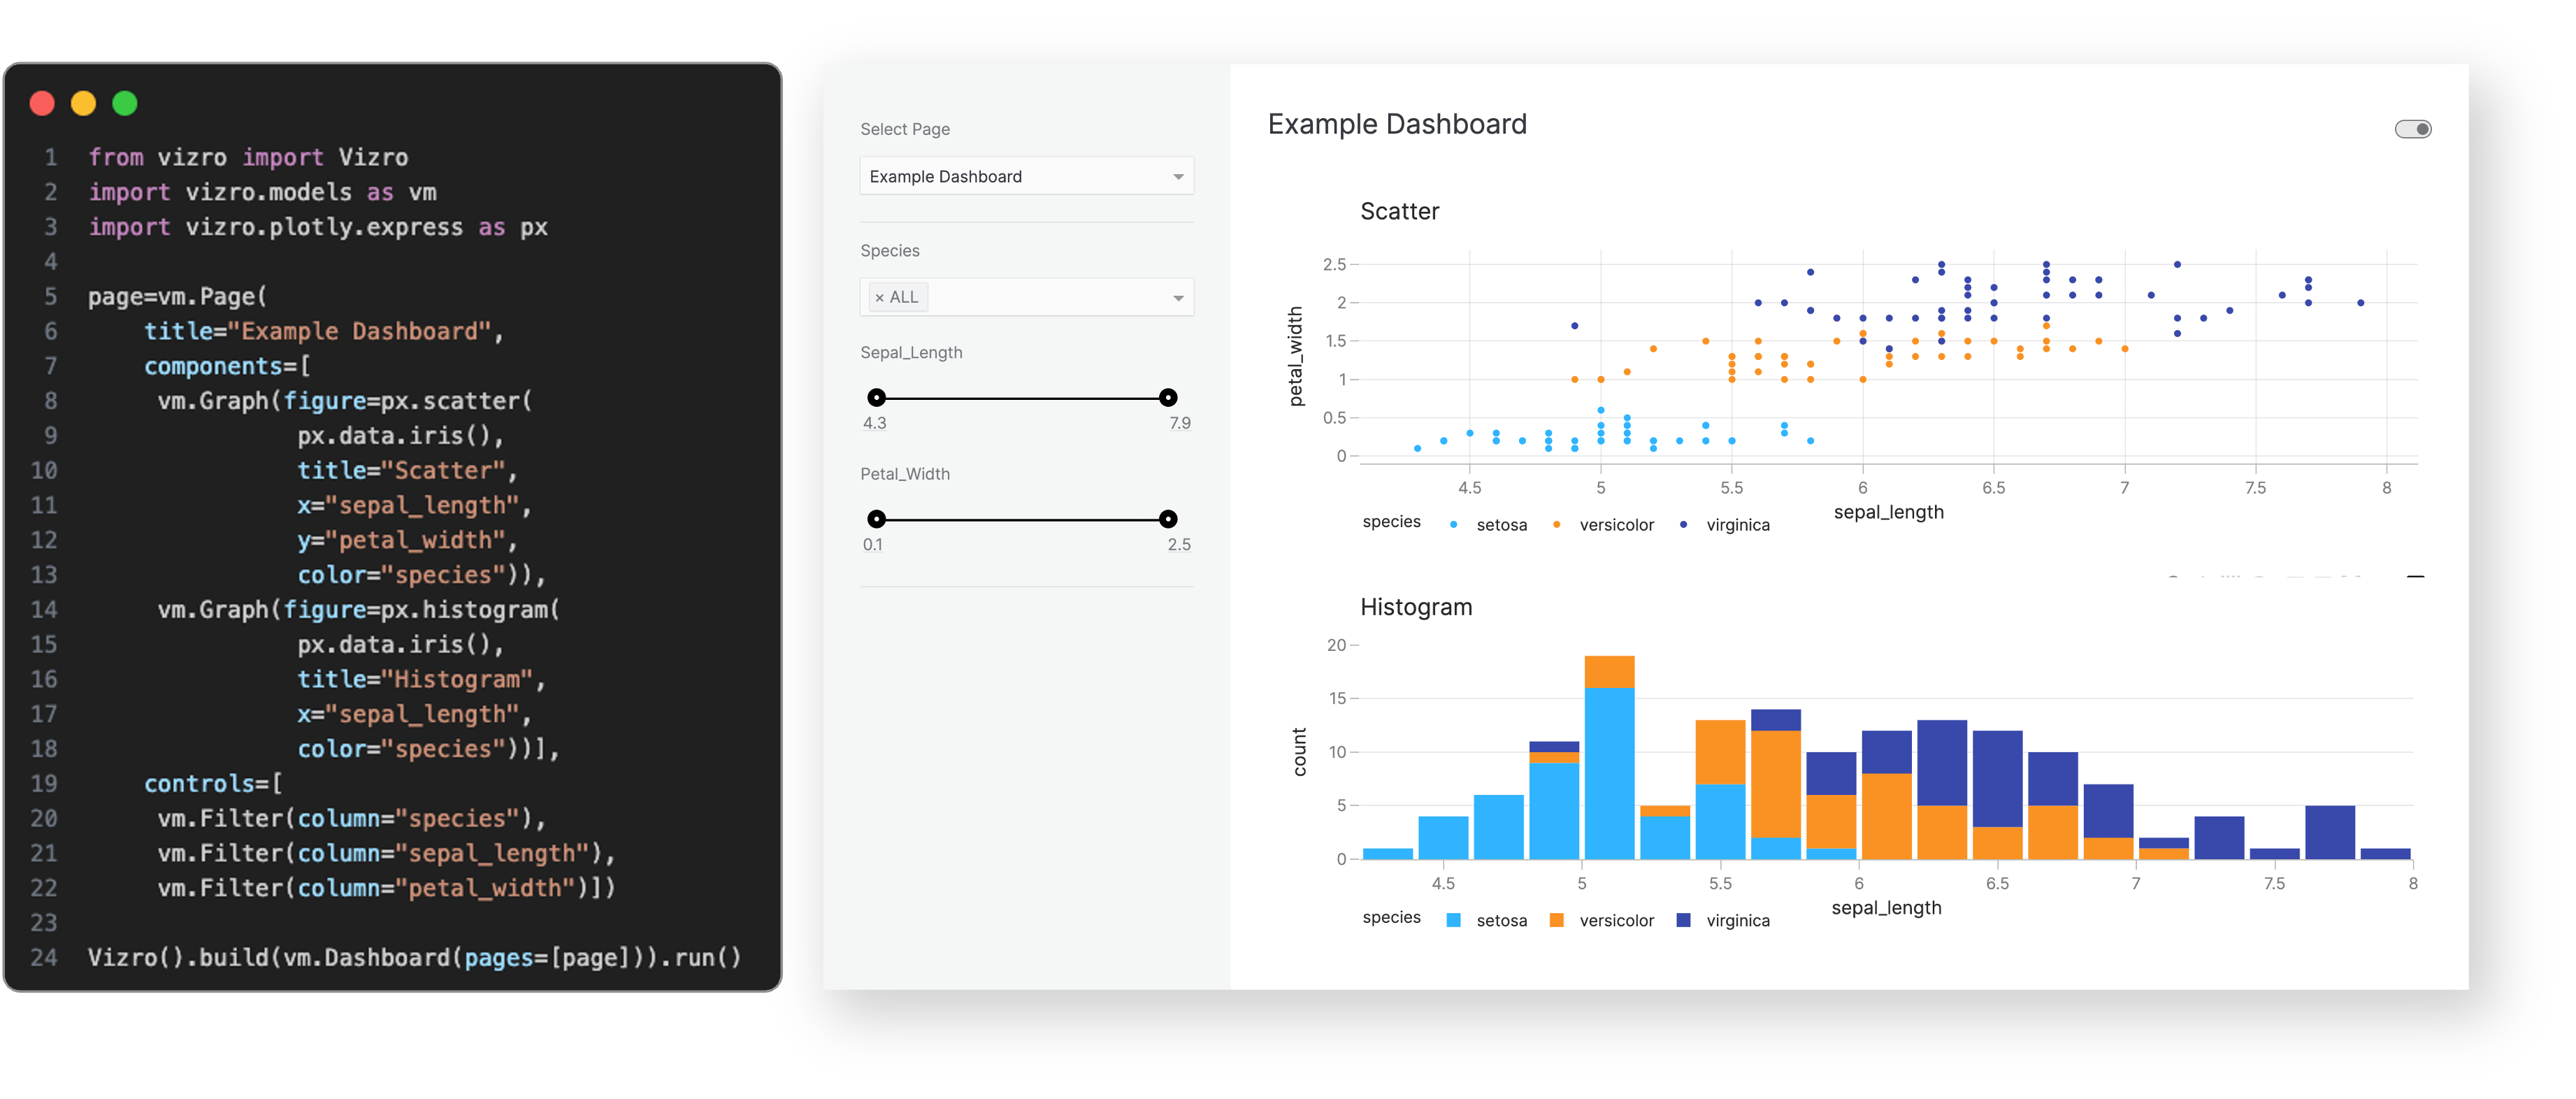
Use a few lines of simple low-code configuration, with in-built visual design best practices, to assemble high-quality
multi-page prototypes.
</div>
<br>
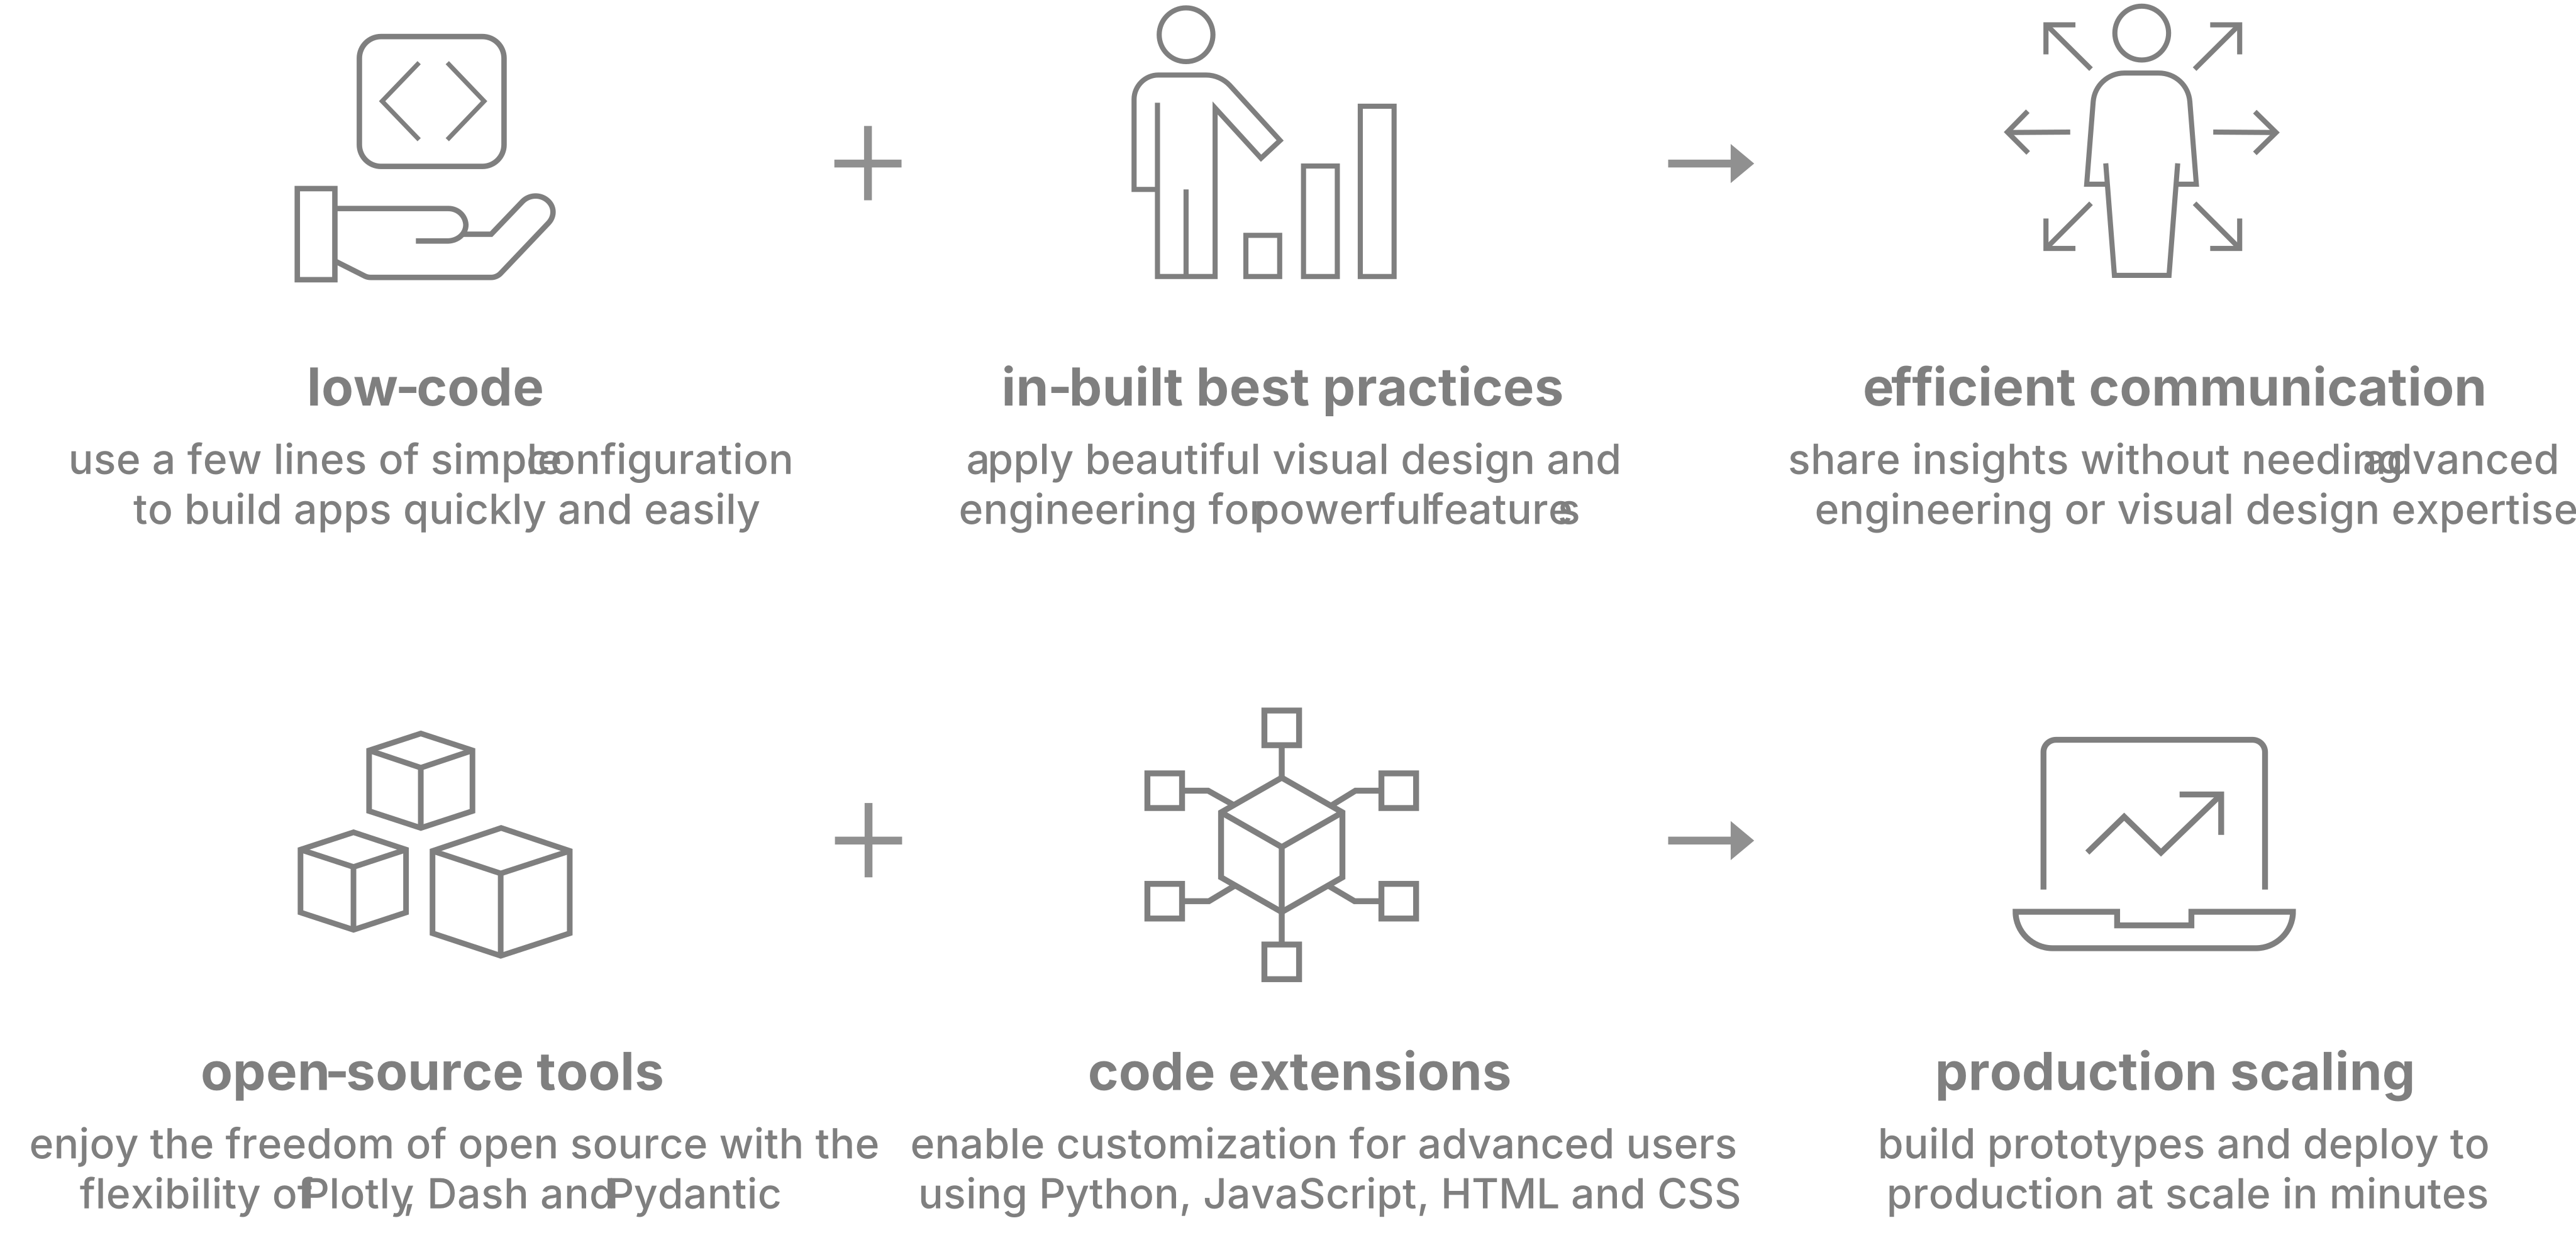
The benefits of the Vizro toolkit include:
<div align="center">
</div>
<br>
Visit our "How-to guides" for a more detailed explanation of Vizro features.
Sign in to leave a review
Use Google, GitHub, or an email account so ratings stay tied to real people.
No reviews posted yet.