@vk0/agent Cost Mcp
About
Local-first Claude Code cost analyzer. Parses JSONL session logs to surface per-tool spend, daily trends, and optimization hints.
Details
- License
- MIT
Explore
- Cost queries: get_session_cost, get_tool_usage, get_cost_trend, get_subagent_tree
- Optimization analytics: get_tool_roi, suggest_optimizations, detect_cost_anomalies
- Predictive tools: get_cost_forecast, estimate_run_cost
- Configuration tools: configure_budget, set_monitor_webhook
- Operates entirely locally on JSONL session logs from Claude Code
- Privacy-preserving with zero cloud dependencies

Setting up with Highlight
This MCP is not yet compatible with Highlight’s one-click setup. However, you can still use it with Highlight by following these steps:
- Download and install Highlight from highlightai.com/download
- Navigate to the plugins tab and select "Add Custom Plugin"
-
Configure the plugin with the settings below
Plugin Name
@vk0/agent Cost McpCommand (node, npx, python, etc.)Please refer to the README for specific instructions on how to obtain API keys or other required environment variables.
- Enable "Start Automatically" if you want the plugin to start when Highlight launches





From the repository
Pick your client. Every option uses npx so there is nothing to install globally.
Claude Code and ccusage already give you useful cost visibility. @vk0/agent-cost-mcp is for the next layer: forensics, attribution, and guardrails.
- you want a quick current-session total or statusline number
- you need daily or period usage dashboards or burn-rate summaries
- you are looking for a polished human-facing monitoring UX
- nothing to configure
Eleven MCP tools, all operating on local JSONL session logs and all aimed at one Cost Guard question: where is spend accumulating, how risky is the current pattern, and what should the operator or agent change next?
Cost queries (read-only):
| Tool | What it does |
|------|-------------|
| get_session_cost | Parse a single Claude Code session and return token totals, turn count, cache usage, and estimated USD cost so an agent can anchor every later Cost Guard question in one concrete run summary. |
| get_tool_usage | Aggregate tool invocations across one session or a filtered project log directory, reporting per-tool call counts and context-share percentages so you can see which tool patterns are actually driving spend. |
| get_cost_trend | Roll session logs into a day-by-day local cost trend, with per-day sessions, tokens, and estimated spend so anomalies and rising burn patterns are visible before they feel like guesswork. |
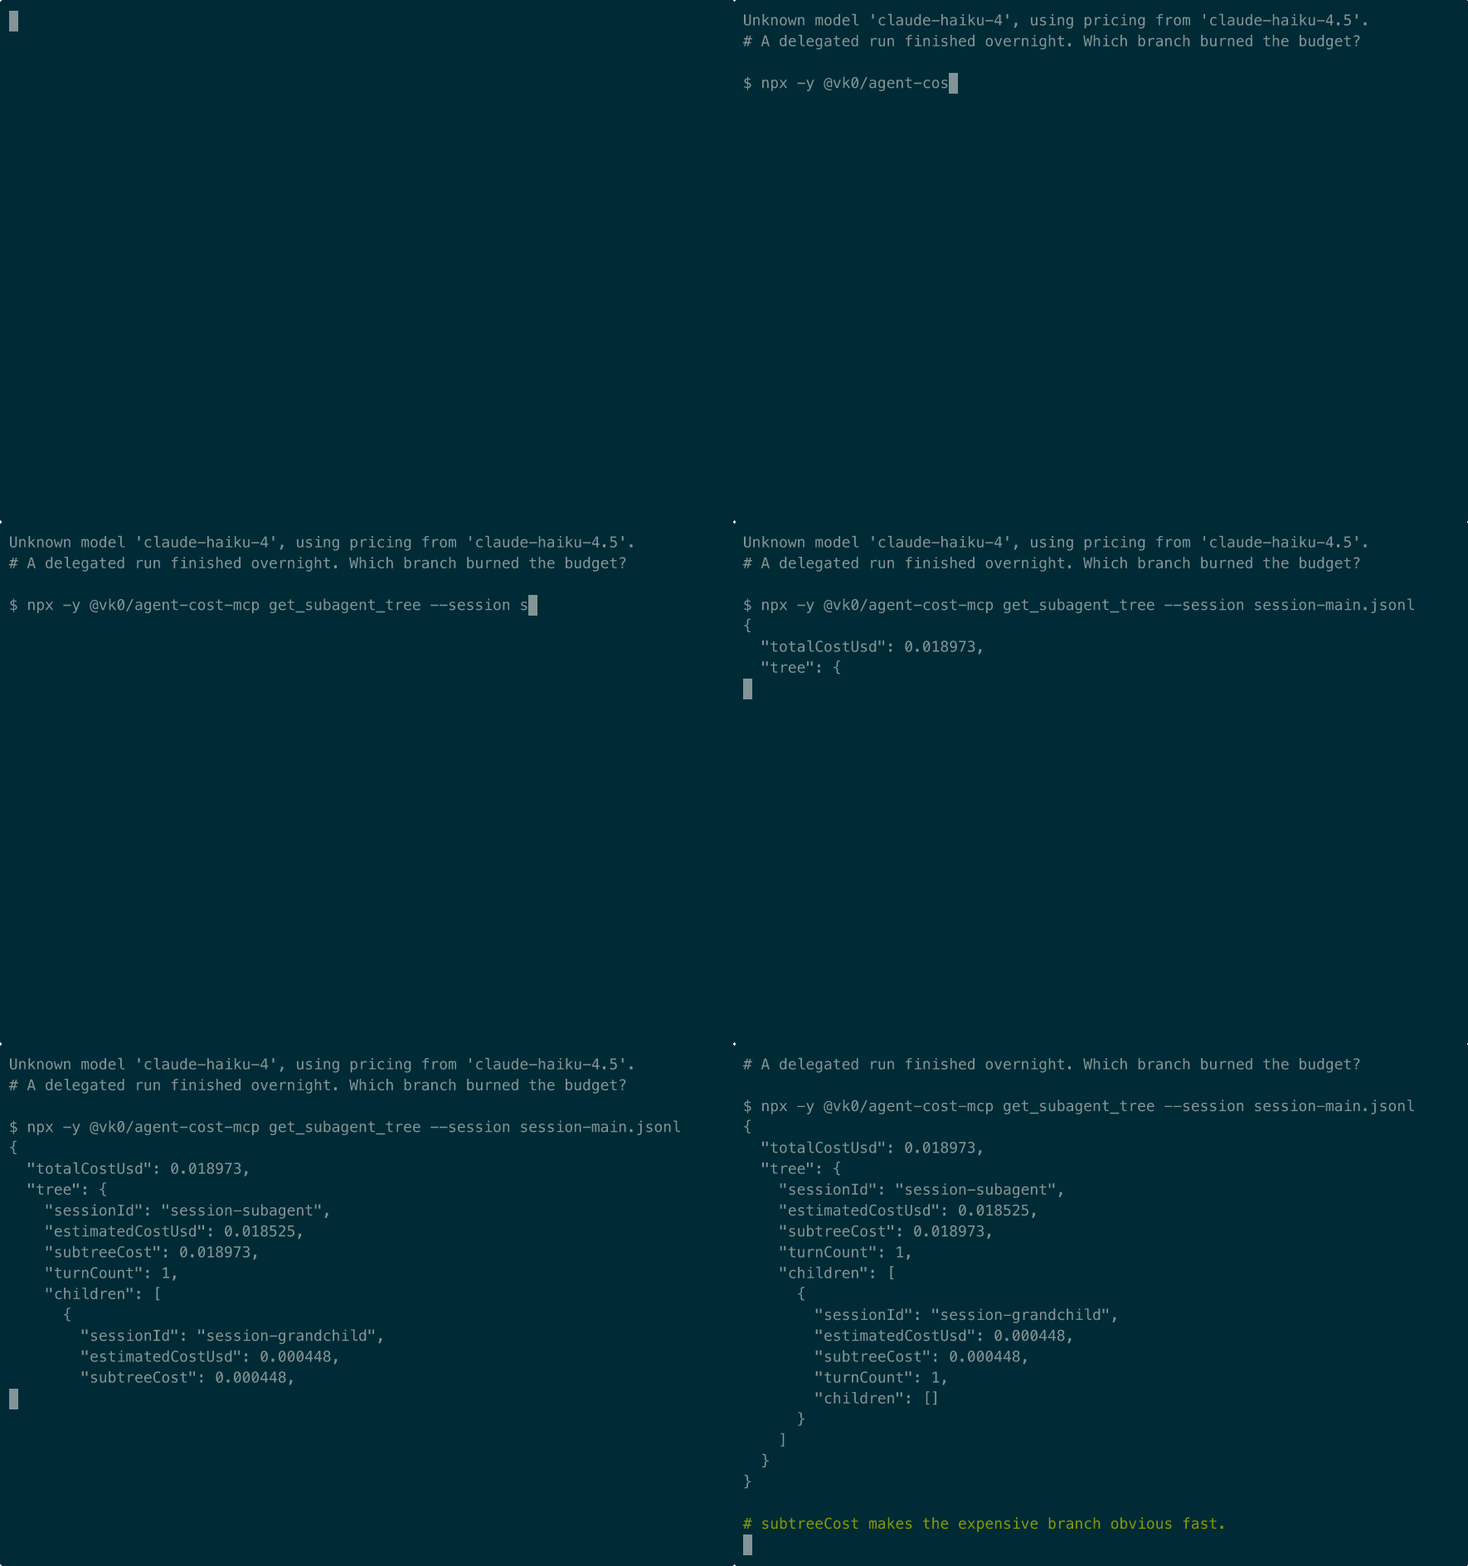
| get_subagent_tree | Return a parent-plus-subagent session tree for one local Claude Code run, with cost summed per branch, so you can see which branch or delegated path actually consumed the budget. |
Optimization analytics:
| Tool | What it does |
|------|-------------|
| get_tool_roi | Rank tools by a bounded ROI heuristic using cost share, linked results, and context share, so repeated calls with weak payoff surface quickly as the classic low-efficiency or runaway-loop signature, while productive same-tool refinement is less likely to be flagged too aggressively after 2.3.1. |
| suggest_optimizations | Generate lightweight optimization suggestions from a parsed session log, including cache-read ratios, abandoned tool calls, and heaviest turns, when you want the next fix to be more concrete than a raw metric table. |
| detect_cost_anomalies | Flag unusually high or low daily cost spikes against the recent local baseline so sudden burn jumps, suspicious drops, and unstable usage patterns stand out without a separate monitoring stack. |
Predictive (pre-spend):
| Tool | What it does |
|------|-------------|
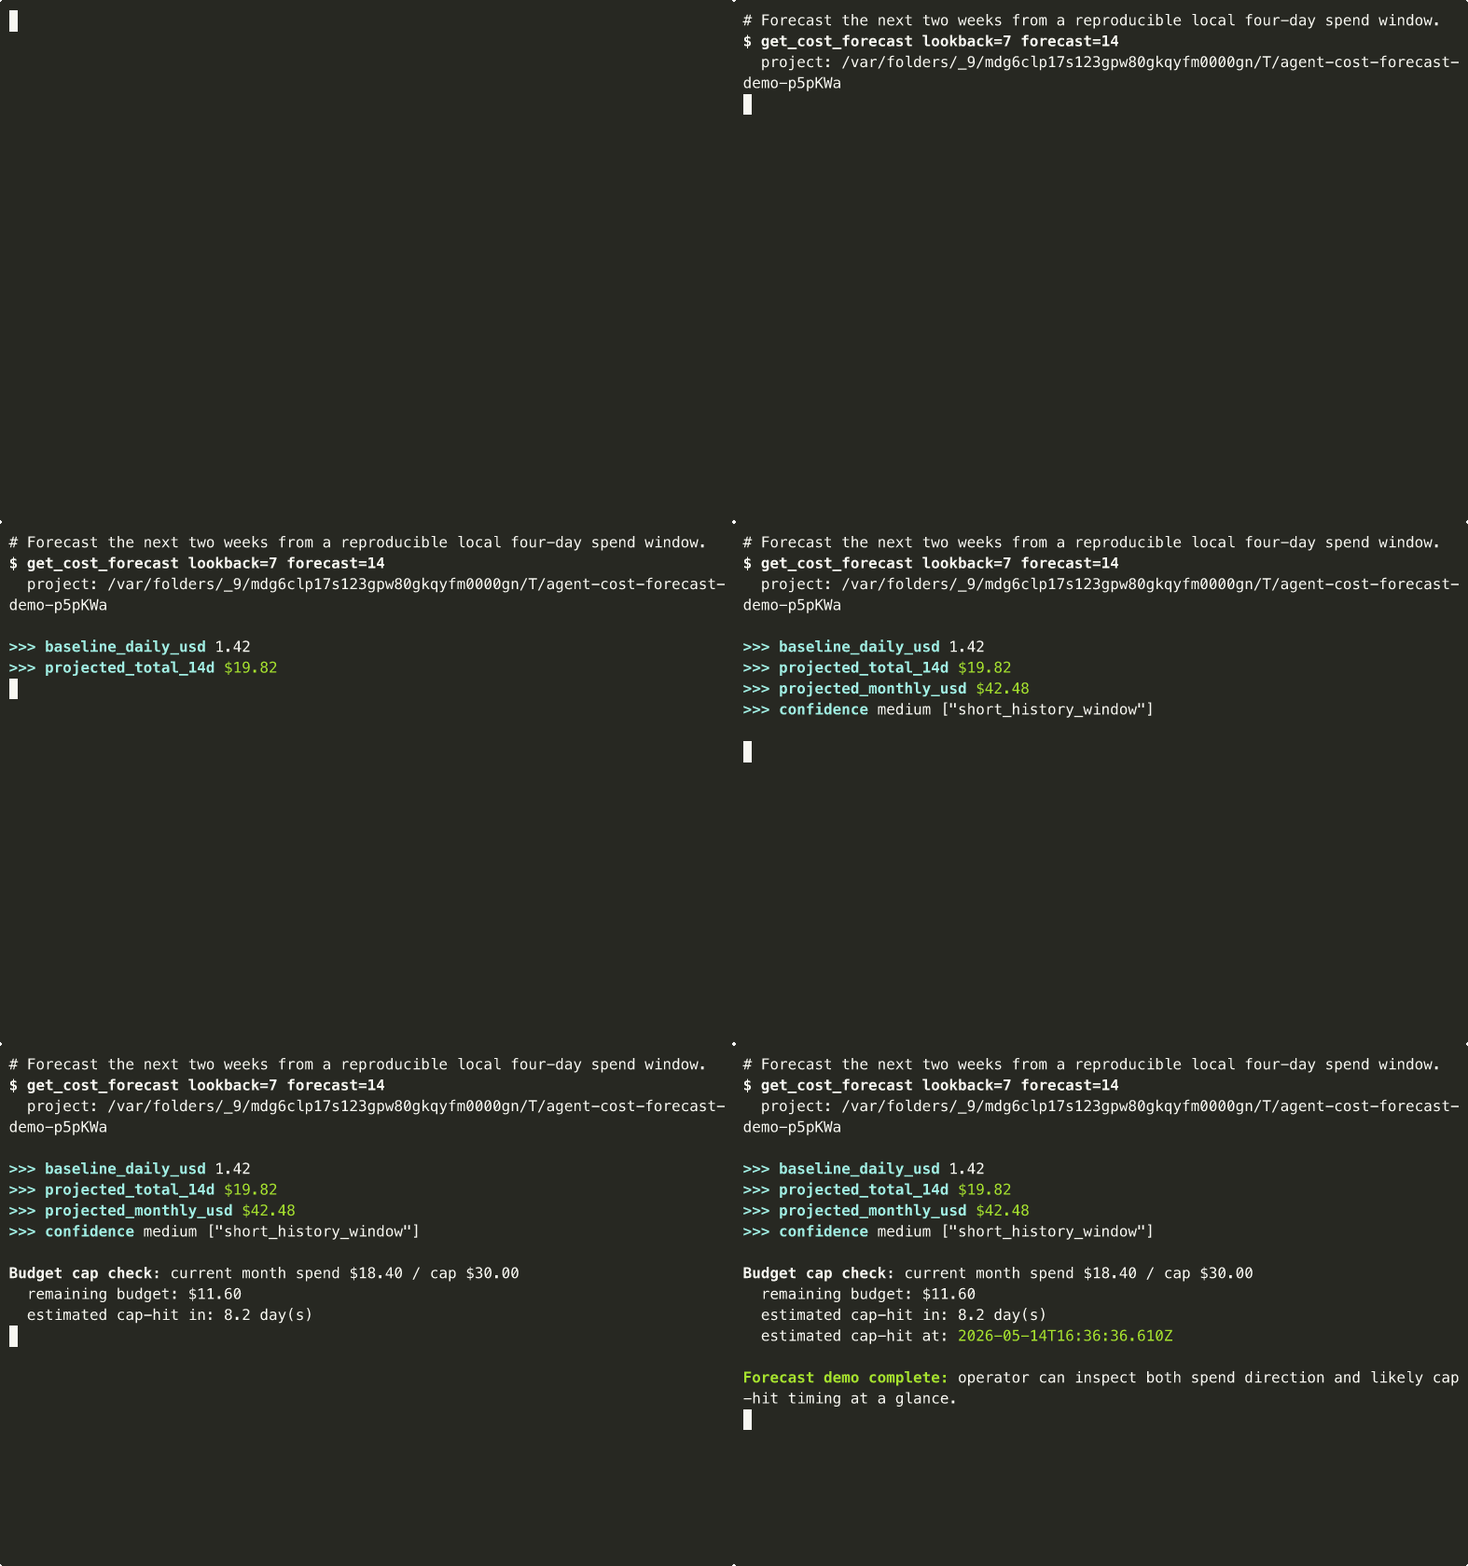
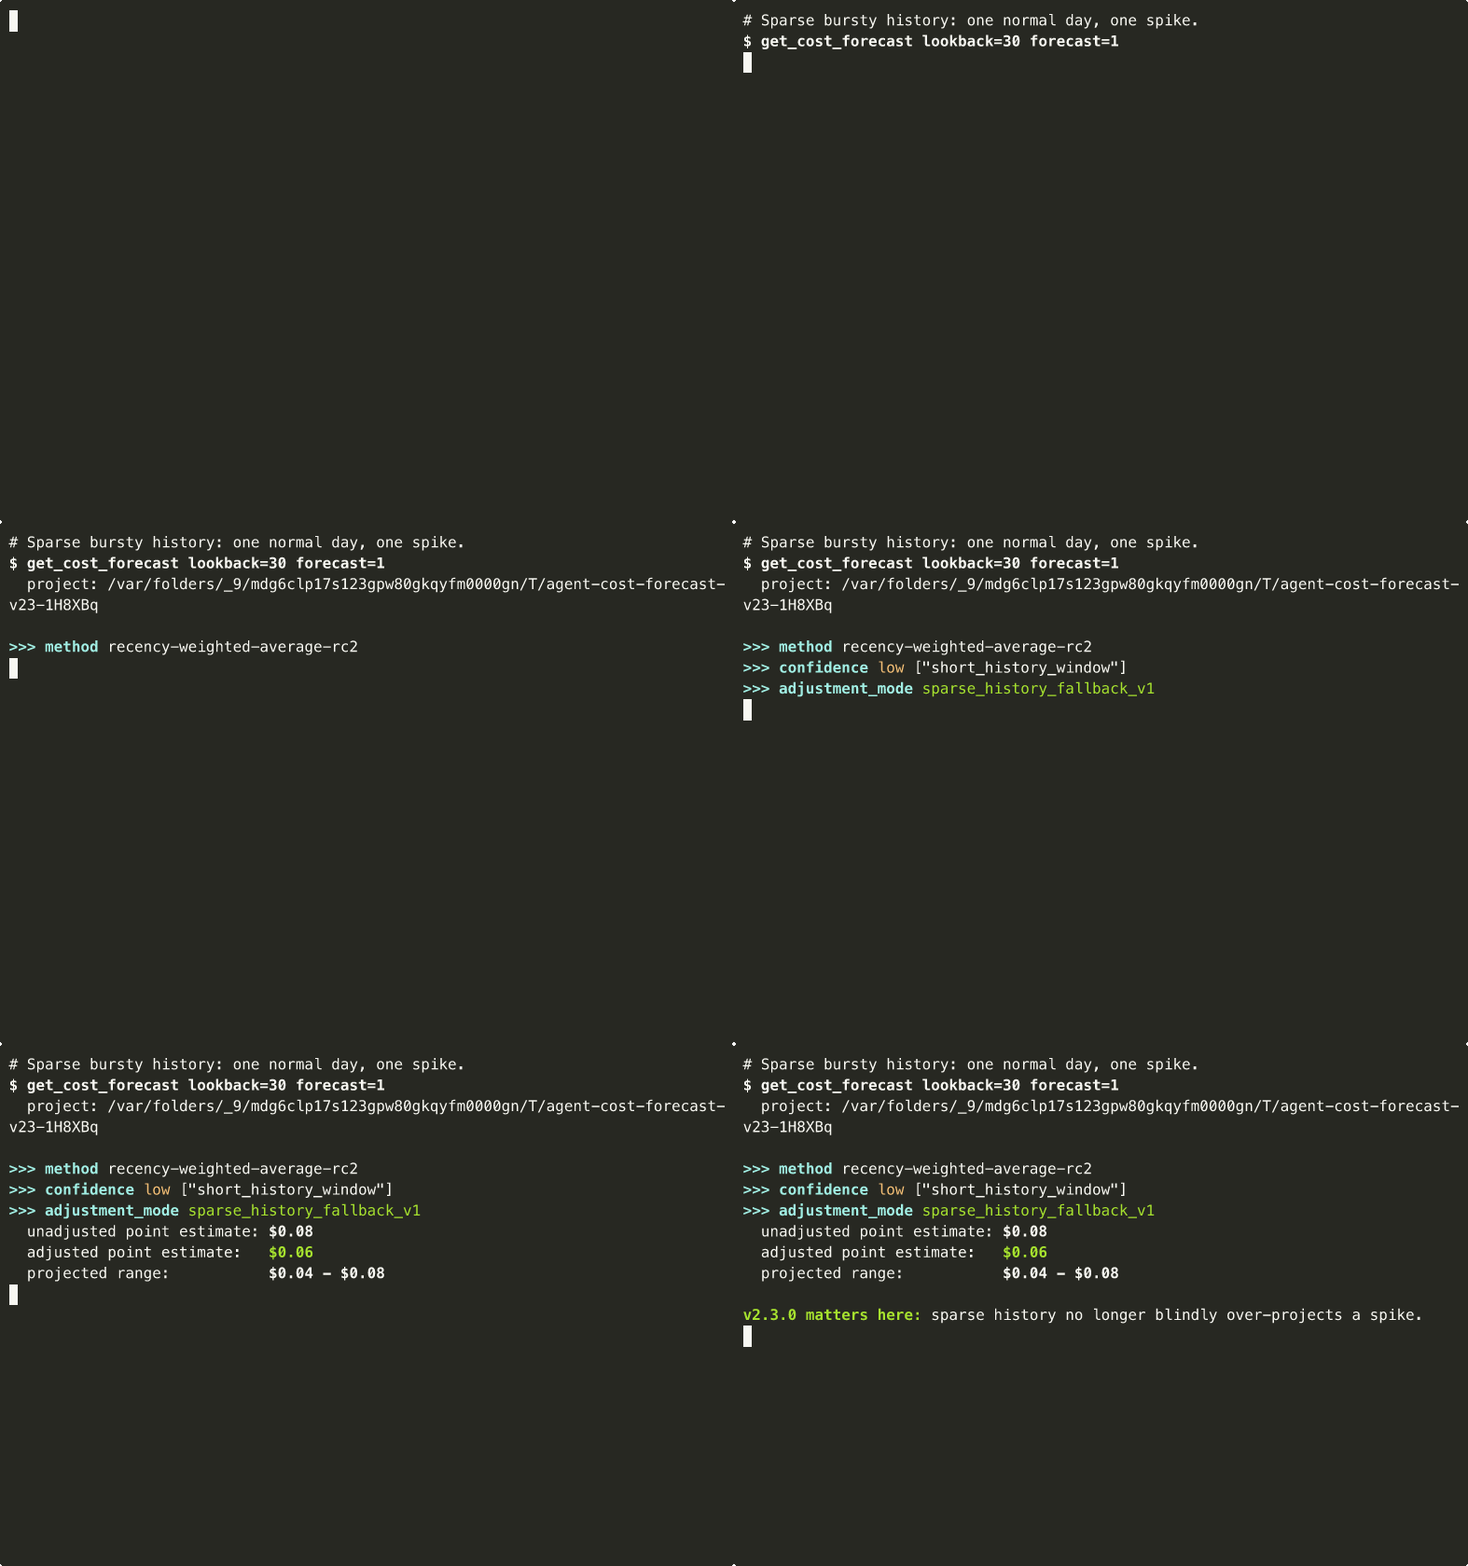
| get_cost_forecast | Project a bounded local cost forecast from recent daily trend data so an operator can ask where spend is heading next, not just where it already went; forecast_confidence is a quartile-based local heuristic, not certainty, and it degrades gracefully when history is still short. |
| estimate_run_cost | Estimate the likely cost of a planned run before execution from prompt, model, and expected tool-call shape, returning {low, expected, high} with confidence for pre-spend decisions. |
Configuration (write):
| Tool | What it does |
|------|-------------|
| configure_budget | Set daily or per-session budget caps with tiered alert thresholds, so the next cost-query tool can return a machine-readable warning before an agent quietly runs past a soft or hard spending boundary. |

| set_monitor_webhook | Register an HMAC-signed webhook target for anomaly alerts, budget threshold crossings, and runaway flags so Cost Guard signals can leave the local session and reach an operator workflow when needed. |
Monitor alerts do not work until set_monitor_webhook has saved both the webhook URL and secret in the local monitor config at ~/.agent-cost-mcp/monitor-webhook.json.
For a quick local test, start a tiny localhost receiver first, then point set_monitor_webhook at http://127.0.0.1:8787/hook:
python3 - <<'PY'
from http.server import BaseHTTPRequestHandler, HTTPServer
class Handler(BaseHTTPRequestHandler):
def do_POST(self):
length = int(self.headers.get("content-length", "0"))
body = self.rfile.read(length).decode("utf-8", errors="replace")
print(f"\n--- webhook {self.path} ---")
print(body)
self.send_response(204)
self.end_headers()
HTTPServer(("127.0.0.1", 8787), Handler).serve_forever()
PY
On Windows, use the same local listener idea with py -3 if python3 is not the Python launcher on your machine.
<details>
<summary><strong>Example: <code>get_session_cost</code> output</strong></summary>
{
"sessionPath": "~/.claude/projects/my-project/session-main.jsonl",
"subagentPaths": [],
"turnCount": 2,
"totals": {
"input_tokens": 2000,
"output_tokens": 500,
"cache_read_input_tokens": 100,
"cache_creation_input_tokens": 50,
"tool_use_count": 1,
"tool_result_count": 1,
"linked_tool_result_count": 1,
"estimated_cost_usd": 0.013718
}
}
<details>
<summary><strong>Example: <code>get_tool_usage</code> output</strong></summary>
{
"projectPath": "~/.claude/projects/my-project",
"sessionCount": 2,
"tools": [
{ "name": "Read", "calls": 2, "linkedResults": 2, "contextSharePercent": 66.67 },
{ "name": "Grep", "calls": 1, "linkedResults": 0, "contextSharePercent": 33.33 }
]
}
<details>
<summary><strong>Example: <code>get_cost_trend</code> output</strong></summary>
{
"projectPath": "~/.claude/projects/my-project",
"days": 7,
"totalCostUsd": 0.027443,
"totalSessions": 2,
"daily": [
{
"date": "2026-04-10",
"sessions": 2,
"costUsd": 0.027443,
"inputTokens": 2400,
"outputTokens": 600
}
]
}
<details>
<summary><strong>Example: <code>suggest_optimizations</code> output</strong></summary>
{
"sessionPath": "~/.claude/projects/my-project/session-main.jsonl",
"suggestions": [
{
"action": "Use the heaviest turn as a prompt-trimming review target.",
"reason": "Turn 1 is the densest token consumer in this session.",
"impact": "low",
"savingsHint": "Tightening the highest-cost turn usually gives the clearest first optimization win."
}
]
}
Claude Desktop / Cursor
Paste into your MCP client config file to install this server.
{
    "mcpServers": {
        "@vk0/agent cost mcp": {
            "agent-cost": {
                "command": "npx",
                "args": [
                    "-y",
                    "@vk0/agent-cost-mcp"
                ]
            }
        }
    }
}McpServers
{
    "agent-cost": {
        "command": "npx",
        "args": [
            "-y",
            "@vk0/agent-cost-mcp"
        ]
    }
}
Quick visibility (native /cost, ccusage) vs Cost Guard forensics (@vk0/agent-cost-mcp)
Claude Code and ccusage already give you useful cost visibility. @vk0/agent-cost-mcp is for the next layer: forensics, attribution, and guardrails.
Use native /cost or ccusage when
- you want a quick current-session total or statusline number
- you need daily or period usage dashboards or burn-rate summaries
- you are looking for a polished human-facing monitoring UX
- nothing to configure
Use @vk0/agent-cost-mcp when
- you want per-tool cost share and ROI ranking with get_tool_roi and get_tool_usage
- you need parent↔subagent cost attribution across branches with get_subagent_tree
- you want anomaly detection against your local baseline with detect_cost_anomalies
- you need forward-looking spend estimates from get_cost_forecast or estimate_run_cost
- you want agent-readable budget caps and hard-stop guardrails via configure_budget
- you need machine-readable next-action suggestions and signed webhook alerts via suggest_optimizations and set_monitor_webhook
Best together
Use native /cost or ccusage for quick visibility; reach for @vk0/agent-cost-mcp when the next question is: which tool, subagent, or branch burned the budget, what happens if the run continues, and what should the agent do next? — answered locally from JSONL, machine-readable.
This package does not replace invoices, org-wide billing systems, or live runtime introspection. It is a local MCP surface for structured cost forensics and guardrails from Claude Code session logs.
Sign in to leave a review
Use Google, GitHub, or an email account so ratings stay tied to real people.
No reviews posted yet.